Maharashtra State Board Class 12 Geography Solutions Chapter 2 Population Part 2
1. Identify the correct co-relation
A : Assertion R : Reasoning
Question 1.
A – Increase in the dependency ratio will affect the economy.
R – Medical costs are high when there are more elderly in the population.
(a) Only A is correct.
(b) Only R is correct.
(c) Both A and R are correct and R is the correct explanation of A.
(d) Both A and R are correct but R is not the correct explanation of A.
Answer:
(d) Both A and R are correct but R is not the correct explanation of A.
2. Write short notes on.
3. Give geographical reasons.
4. Differentiate between.
Donor Region | Recipient region |
(i) Donor region is the region from where people migrate to other areas. | (i) Recipient region is the region, where migration takes place or region where people go. |
(ii) In donor region due to reduction in local population there is less utilisation of public facilities like transport, water supply, education, recreation etc. | (ii) In recipient region due to increase in population there is more pressure on public facilities like transport, water supply, education, recreation etc. |
(iii) The expenditure on the public facilities is not utilised fully. | (iii) The public facilities are not sufficient for increasing population. |
(iv) From donor region mostly young men migrate to other areas in search of jobs, business or education. | (iv) More young men are added to population for job opportunities or business or education. |
(v) There are changes in age and sex ratio, there are more women, children and old age population than young age people. | (v) There are changes in age and sex ratio. There are more male than female and more young age population. |
(vi) There is more non-working or dependent population, it has adverse effect on economy of that area. | (vi) There is more working age population, with innovative ideas, concepts, etc., which helps technological and economic development of the region. |
Expansive pyramid | Constrictive pyramid |
(i) Expansive pyramid is very broad at the base and becomes narrow at the apex. | (i) Constrictive pyramid is narrow at the base and broader at the apex. |
(ii) It shows that there is higher percentage of young people but lower percentage of old age people in the country. | (ii) It shows that there is high percentage of old age people and lower percentage of young age people in the country. |
(iii) It indicates high birth rate making the base broad and high death rate making the apex narrow. | (iii) It indicates low birth rate making the base narrow and low death rate making the apex broad. |
5. Answer the following questions in detail.
2. With the help of population pyramid, age-wise and gender-wise population of the country can be studied.
3. Age structure and sex ratio are important aspects of population of the country.
4. In population pyramid, percentage of population in age groups are shown on the X-axis. Whereas markings of age groups are shown on the Y-axis.
5. The right side of the pyramid shows female population and left side shows male population.
6. As the age groups are on Y-axis, the base of pyramid indicates young age population, and apex of pyramid indicates old age population and middle portion of pyramid indicated adult population.
7. When old age population is more, it leads to more non-working population and there is increased expenditure on medical and health facilities.
8. When younger age population is more, it also leads to more non-working and dependent population. This causes a burden on the economy.
9. When adult age population is more, then working population is more. This helps the development of the country.
10. The population pyramid makes us understand age-wise and sex-wise population as per following:
11. There are three types of population pyramids which depicts the birth rate and death rate.
Class 12 Geography Chapter 2 Population Part 2 Intext Questions and Answers
Try this.
Country | Retirement Age reforms being implemented or under consideration (in years) |
Germany | Retirement age to increase gradually to 66 by 2023 and to 67 by 2029 |
United States of America | Retirement age to rise gradually to reach 67 for those born in 1960 or later |
United Kingdom | Retirement age to increase for both men and women to 66 by October 2020 and further to 67 between 2026-28 |
Australia | Retirement age scheduled to increase gradually to 67 by 2023 |
China | By 2045, to increase retirement age for both men and women to 65 |
Japan | Under consideration to raise the retirement age to 70 |
India | On an average, 60 years. May vary from 55 years to 65 years according to services |
(i) What does the table show?
(ii) Classify these countries into developed and developing.
(iii) What could be the reason behind increasing the retirement age in these countries?
(iv) What will be the impact of increase in the retirement age on the economy of the respective countries?
(v) Why is China considering increasing the age later in 2045?
(vi) Considering these examples from developed countries, will it be good for India to increase its retirement age? Express your views.
(vii) Write a concluding statement about the relationship between age structure, life expectancy and economy of a country.
(i) The table shows country wise retirement age reforms implemented or under consideration (in years).
(ii) Germany, United States of America, Australia and Japan are the developed countries and China and India are the developing countries.
(iii) Many countries have considered or considering the increase in retirement age because increase in ageing population increases pressure on pension funding, retirement provisions and medical facilities.
(iv) Due to increase in retirement age and life expectancy people can work for many years. This will reduce pressure on pension funding, retirement provisions and expenses on medical facilities.
(v) China is considering increasing the age of retirement later in 2045 because the proportion of children and young adult population is going to decrease in the age structure of the country.
(vi) From economic point of view, it is yes. India should increase retirement age because in India too expectancy of life in higher age groups is increasing. If we increase retirement age it will reduce pressure on pension fund and medical facilities.
But from the socio-economic point of view, it is not advisable to increase retirement age because the rate at which population in working age group is increasing, job opportunities are not increasing. If you increase retirement age, unemployment in working age population will increase. This will lead to many socio-economic problems.
(vii) A country in which large percentage of population is in working age group and the life, expectancy is high, large human force will be available for the economic development. However, if large percentage population is found in younger age group and elderly age group, dependency ratio will be high and the country will have slow economic development.
Question 3
Maharashtra Board Solution
You have already made a list of the reasons why migration occurs. Add more reasons to it. Discuss and classify these reasons into pull and push factors and complete the figure. (Textbook Page No. 19)
Solution & Step-by-Step Answer:
Question 4
Maharashtra Board Solution
Complete the following table which shows impact of migration on the population. (Textbook Page No. 20) |
Type of migration | Positive effects | Negative effects |
Internal migration | Employment is available to migrants. Improves their financial status. | Resources are affected. Sometimes, they might be sent back to their original country. |
Rural to urban migration | – | – |
Urban to rural migration | – | – |
Rural to rural | – | – |
Seasonal / Temporary | – | – |
Type of migration | Positive effects | Negative effects |
Internal migration | Employment is available to migrants. Improves their financial status. | Resources are affected. Sometimes, they might be sent back to their original country. |
Rural to urban migration | Cheap labour is available | Pressure on civic amenities, housing problems |
Urban to rural migration | Migrants enjoy better environment | Difficult to adjust with limited resources |
Rural to rural | Improvement in financial conditions | Clashes between locals and migrants |
Seasonal / Temporary | Temporary increase ineconomic activities. | Temporary pressure on civic amenities & housing problem. Give it a try.
Question 1
Maharashtra Board Solution
On the basis of the survey done in practical 1, draw a population pyramid for the people in 15 households. Write your conclusions after studying the structure of the population. (Textbook Page No. 13)
Solution & Step-by-Step Answer:
[Students have to attempt this question on their own.]
Question 2
Maharashtra Board Solution
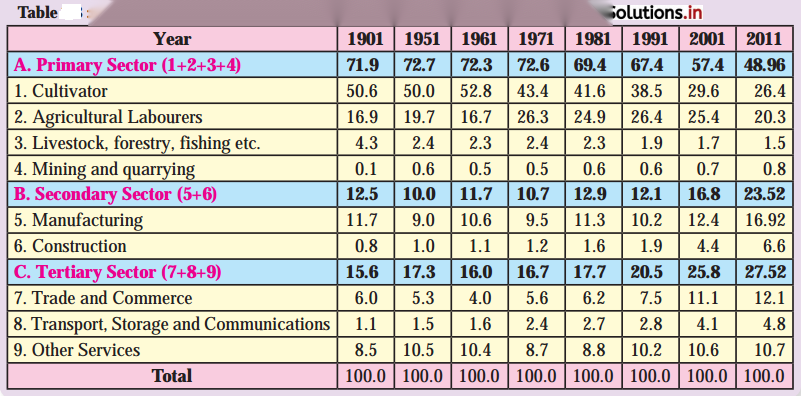
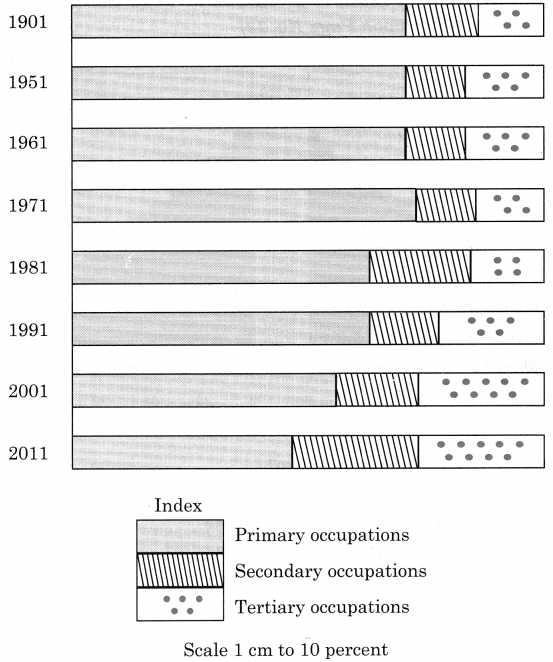
Study the below table carefully and answer the following questions. (Textbook Page No. 16) (i) What does the table show? (ii) Which sector has the highest occupation? In which year? (iii) Which sector has the lowest occupation? In which year? (iv) In which sector is the working population occupation decreasing? (v) In which sector is the working population increasing? (vi) Draw a suitable diagram for statistical information showing A, B and C columns from 1901 to 2011. (vii) Compare the data. Write a concluding paragraph on the graph.
Solution & Step-by-Step Answer:
(i) The table shows occupational structure of India. (ii) The primary sector has the highest occupation. It is 72.7 percent in 1951. (iii) Secondary sector has the lowest occupation. It is 10.00 percent in 1951. (iv) In the primary sector the working population occupation is decreasing. (v) In the secondary and tertiary sector, the working population is increasing. (vi ) Divided Horizontal Percentage Bar Graph
(vii) After studying the occupational structure of India from 1901 to 2011 the following trend is observed: Can you tell?
Question 1
Maharashtra Board Solution
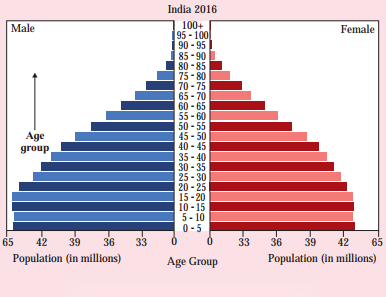
The population pyramid of India is given below. Read the pyramid and answer the following questions. (Textbook Page No. 13) (i) Which pyramid type does India belong to? (ii) Comment upon the age structure of its population.
Solution & Step-by-Step Answer:
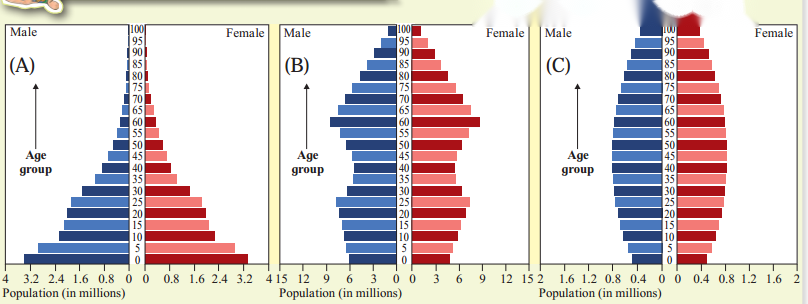
(i) The pyramid of India belongs to expansive A type.
(ii) The shape of the India’s population pyramid has a broad base and narrowing apex. This indicates the population below the age 0-15 years is very large and population in the age above 60 years is very small.
Question 2
Maharashtra Board Solution
Read the following table and answer the questions that follow: (Textbook Page No. 14) |
Decade | Ratio of working / non-working population | Percentage of working population |
2001 – 10 | 1.33 : 1 | 57.1 |
2011 – 20 | 1.53 : 1 | 60.5 |
2021 – 30 (projected) | 1.81 : 1 | 64.4 |
2031 – 40 (projected) | 1.72 : 1 | 63.2 |
(i) What does the table show?
(ii) What is the relationship between second and third column?
(iii) How will this relationship affect the economy of India?
(iv) What will happen if the ratio decreases over the years?
(i) The table shows India’s Demographic Dividend from 2001 to 2004
It contains data of ratio of working population to non-working population and percentage of working population.
(ii) 1. Both columns represent the working, non-working or dependent population in India during each decade.
2. Second column represents this information in the form of ratio of working population to non-working population.
3. Third column represents the same information about working and non-working population in the form of percentage.
4. The relationship between second and third column is very clear as the percentage of working population increases, we find increase in ratio in the second column.
(iii) 1. An economy of any country depends upon the working population, as working population
helps in generation of wealth through various economic activities.
2. When the ratio of working population to non-working population is higher, it helps in increasing economic position of the people, their standard of living and hence this economic benefit percolates in the society by the purchase of goods and services.
3. As per this table, next decade 2021-2030 is the most favorite for the economy of India as both ratio and percentage of working population will be highest in this decade.
(iv) 1. Decrease n the ratio indicates that the non-working population or dependent population is increasing as compared the working population.
2. This is likely to happen when the expectancy of life increases due to improvement in medical facilities, better living conditions.
3. Therefore, more money is required for non-working or dependant population. This may increase financial burden on the economy.
4. We will have to divert more money for non-working population, which would have been useful for other development projects/activities.
Question 3
Maharashtra Board Solution
Read the following graph and
Solution & Step-by-Step Answer:
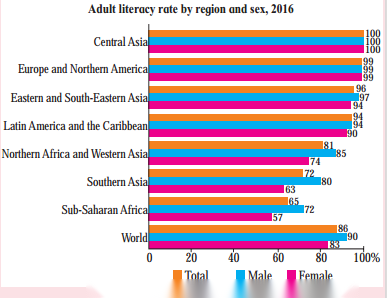
the following questions (Textbook Page No. 16) (i) Which region has the highest literacy rate? (ii) Which region has the lowest literacy rate? (iii) In which region does women fare better than men in literacy rate? (iv) Write a concluding paragraph about the graph. Answer: (i) Central Asia region has the highest literacy rate.
(ii) Sub-Saharan Africa region has the lowest literacy rate. (iii) In no region does women fare better than men because in all the regions the graph shows literacy rate of men is higher than women. (iv) The graph shows the percentage of literate male and female and total literacy rate of seven regions and the world. In all seven regions the highest literacy rate of both male and female is recorded in Central Asian region, whereas the lowest literacy rate of male and female is recorded in Sub-Saharan Africa. In all seven regions and world too, male literacy rate is higher than female literacy rate.
Question 4
Maharashtra Board Solution
On the basis of which other characteristics can you explain the composition of population. Make a list. (Textbook Page No. 17)
Solution & Step-by-Step Answer:
We can divide population on the basis of many other characteristics as per following.
Find out.
Question 1
Maharashtra Board Solution
Find out India’s sex ratio as per Census 2011. (Textbook Page No. 14)
Solution & Step-by-Step Answer:
Sex ratio in India as per census 2011 is 943 females per 1000 males.
Question 2
Maharashtra Board Solution
Find out the minimum age taken into consideration for calculating literacy. (Textbook Page No. 16)
Solution & Step-by-Step Answer:
Use your brain power!
Question 1
Maharashtra Board Solution
If you travel to a place for a few days with your family, will it be considered migration?
Solution & Step-by-Step Answer:
It will be temporary type of migration or migration for pleasure. For example, people go to Kashmir for 10/15 days.
Read the events (Textbook Page No. 17 and 18) and answer the questions that follow:
Question 1
Maharashtra Board Solution
What similarities do you find in these events?
Solution & Step-by-Step Answer:
The similarities in these events are that all are migrated from their original place because of physical, economic, social or political reasons. They have left their place and have migrated to other areas as per their requirements.
Question 2
Maharashtra Board Solution
Is there a change in the location in these events? Why?
Solution & Step-by-Step Answer:
Question 3
Maharashtra Board Solution
Arrange these six events according to the difference in the relative distance between the new and old location.
Solution & Step-by-Step Answer:
Relative distance travelled by Sahmat and Babanrao is very vague and therefore it is not included in the above table.
Question 4
Maharashtra Board Solution
Make a list of reasons for leaving the original location.
Solution & Step-by-Step Answer:
Question 5
Maharashtra Board Solution
Classify the reasons into willing and reluctant migration.
Solution & Step-by-Step Answer:
Question 6
Maharashtra Board Solution
Make a list of reasons behind migration besides the one given here.
Solution & Step-by-Step Answer:
The following is the additional list of reasons for migrations. People migrate for
|