Maharashtra State Board Class 12 Geography Solutions Chapter 1 Population Part 1
1. Identify the correct correlation.
A – Assertion R – Reasoning
Question 1.
A – Areas which have fertile soil have dense population.
R – Fertile soils are good for agriculture.
(a) Only A is correct.
(b) Only R is correct.
(c) Both A and R are correct and R is the correct explanation of A.
(d) Both A and R are correct but R is not the correct explanation of A.
Answer:
(c) Both A and R are correct and R is the correct explanation of A.
2. Write short notes on.
2. Generally, mountains are thinly populated, plains are thickly populated and plateaus are moderately populated.
3. The mountains and hilly areas are less populated because of limited means of livelihood; agriculture is poorly developed and transportation facilities are limited. For example, north eastern states of India have less population due to hilly and mountainous relief.
4. On the other hand, plains are densely populated because of fertile soil and well-developed agriculture. Due to plain relief, it is easy to construct roads and develop industries. Better employment facilities attract people in these areas. For example, Ganga plains are thickly populated.
5. In short, we can say plains are densely populated and mountains and plateaus are sparsely populated.
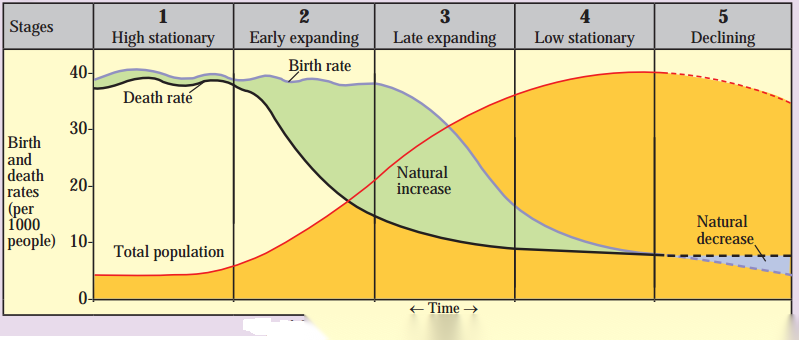
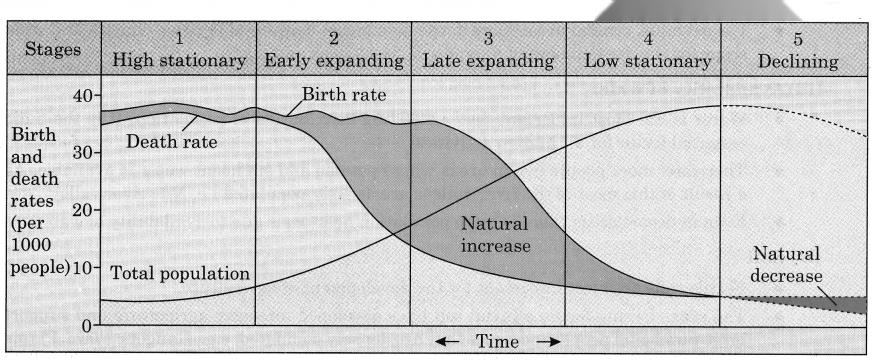
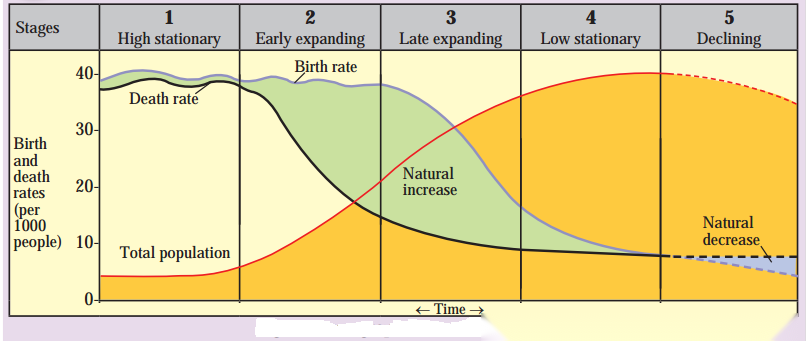
2. From second stage to this stage, death rates are decreasing. Birth rates are also decreasing. Decrease in both birth rates and death rates, reduces the rate of growth of population. But actually, population is growing because the birth rates are higher than death rates.
3. In this stage, since the country is making progress, the income of the people is above the subsistence level and there is an improvement in the standard of living of the people. Poverty is also reducing.
4. There is development of technology as a result secondary and tertiary activities develop.
5. Due to increase in education level, people understand the importance of family planning so size of family reduces.
6. In short in stage 3 countries are moving from developing stage to developed stage.
3. Give geographical reasons.
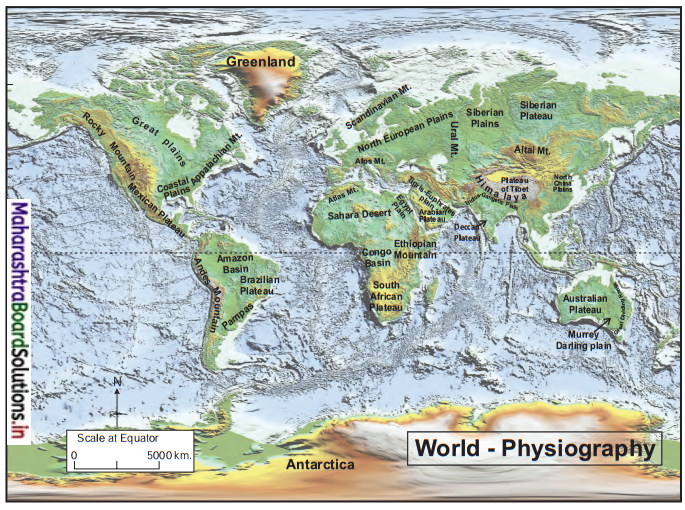
2. For example, if you consider relief factor, mountains and hilly areas are thinly populated. Plateau regions are moderately populated and plains are densely populated. The Himalayan region in India is thinly populated but the Gangatic plains are thickly populated and Deccan plateau region are moderately populated.
3. The distribution of population also depends upon human factors such as agriculture, mining, transportation, urbanisation etc.
4. For example, agriculture or mining activities support large population since they provide source of living to many people.
5. Sometimes government policies also affect population distribution. For example, government provided land, water, electricity at concessional rate in New Mumbai area to attract people and to reduce pressure of population in Mumbai city.
2. Such areas provide favourable conditions for the development and manufacturing industries, which generate employment. Therefore, people from different areas migrate in search of jobs. Thus, such areas become densely populated. For example, Gangetic plain of India, where the density of roads and railways is highest in India.
3. Population increases in port cities due to availability of sea transport for the development of trade. Therefore, the coastal region is densely populated. For example, many port cities like Chennai, Mumbai are developed on the east and west coast of India.
4. Thus, population increases because of transportation facilities.
When birth rate is low and death rate is also low, then though the number of live births per thousand population are less, but due to a smaller number of deaths per thousand population, there is increase in population of the country.
Density of population is the ratio between total population and a total area of that region or country.
For example, as per the census of 2011, Density of population in India is 325 persons per sq. km. It is a ratio between total population in India and total area of India in sq. kms.
In some countries total population may be less but the density of population is high due to small area of the country. For example, Bangladesh’s total population is less but area of country is small therefore, density of population is high.
In some countries total population may be more but the density of population is low due to very large area of the country. For example, Brazil has more total population but area of country is also large therefore, density of population is low.
Thus, population density is a function of population and area of a region.
4. Answer the following questions in detail.
(i) Relief
(ii) Climate
(iii) Availability of water
(iv) Soil
5. Draw a neat labelled diagram for demographic transition theory and its various stages.
Answer:
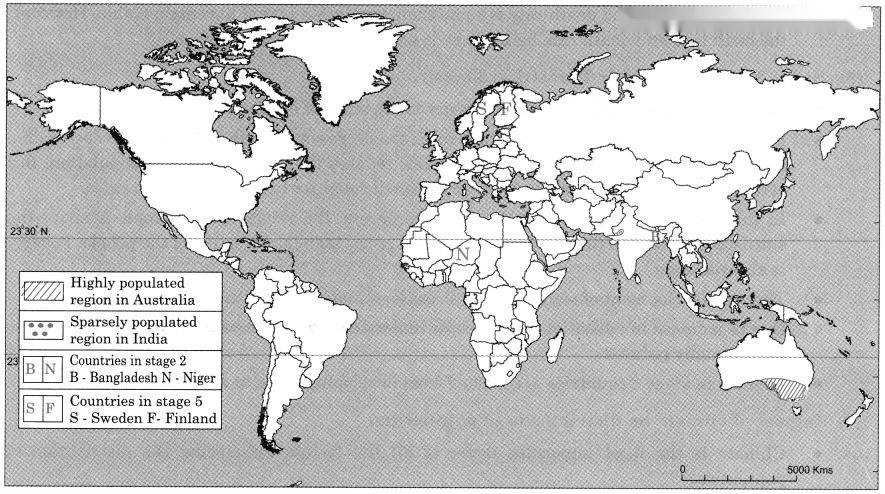
6. Mark and name the following on the outline map of the world with suitable index.
(a) Highly populated region in Australia.
(b) Sparsely populated region in India.
(c) Any 2 countries in stage 5 of demography transition theory.
(d) Any 2 countries in stage 2 of demographic transition theory.
Answer:
Class 12 Geography Chapter 1 Population Part 1 Intext Questions and Answers
Try These

Question 2
Maharashtra Board Solution
Look at the below figure and
Solution & Step-by-Step Answer:
the questions that follow:
Answer: Give it a try
Question 1
Maharashtra Board Solution
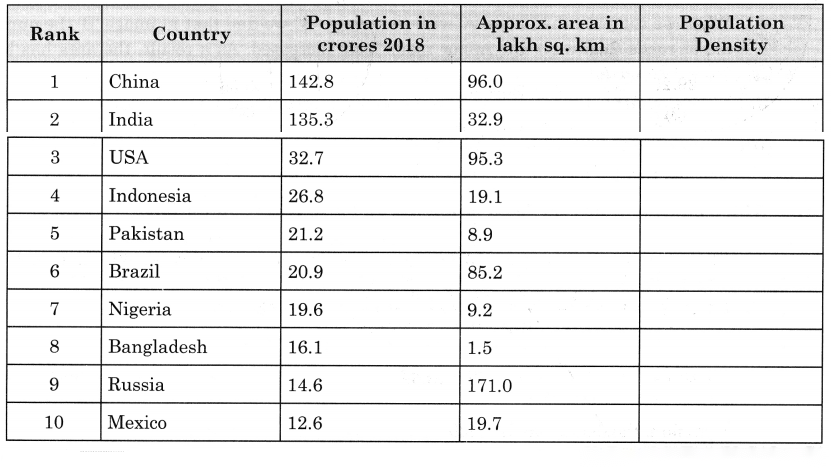
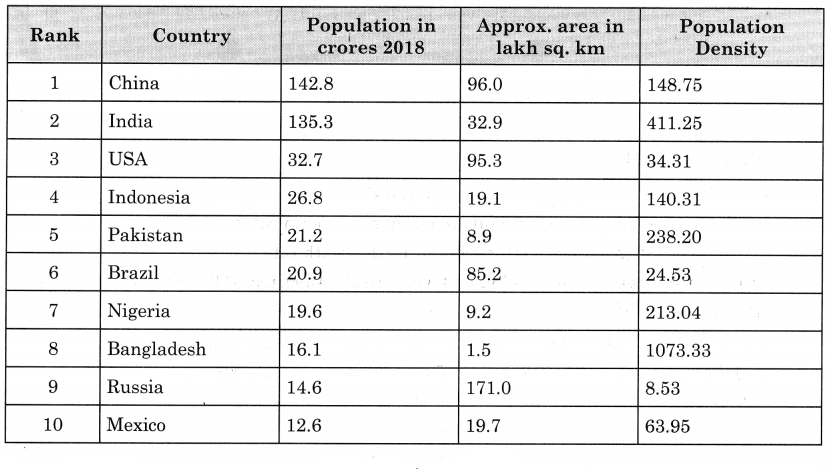
The below table shows the 10 most populated countries in the world in 2018 with their areas. Calculate their population densities and complete the table. (Text book pg.no – 1)
Solution & Step-by-Step Answer:
Question 2
Maharashtra Board Solution
The satellite image given in Fig. They show the same area from two different periods. (Text book pg.no – 6) |

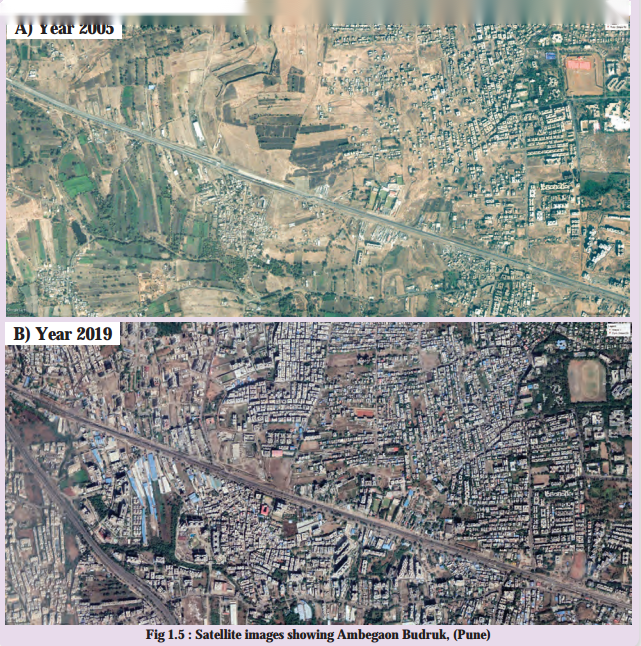
1. The satellite image ‘A’ is image of the year 2005 and satellite image ‘B’ is of the year 2019. That means there is a difference of 14 years in these two images.
2. In image ‘A’ you can see that there are a few roads, limited settlements and most of the areas are covered by agricultural fields, and there is thin population.
3. When we compare the image ‘A’ with the image ‘B’, we find that in image ‘B’ the number of major roads (highway) and minor roads have increased. As a result, the area has become more accessible and thickly populated.
Due to development of industries and employment opportunities there is development of transport.
Question 3
Maharashtra Board Solution
1. Can you calculate the death rate if the total number of deaths in the above city was 2,986 in the same year? 2. On the basis of the birth rates given in earlier and death rates calculated, what change in population do you observe?
Solution & Step-by-Step Answer:
1. Total population of a city is 223000 and total deaths in the city are 2986 in that year. Death Rate = × 1000 Death Rate = × 1000 = 13.39 Therefore, the death rate is 13.39.
2. In earlier example birth rate was 14.57 and the death rates calculated is 13.39. It means death rate have decreased by 1.8. It means the population has increased.
Question 4
Maharashtra Board Solution
Look at the graph in Fig. carefully. Answer the following questions: (Text book pg.no – 9) |
Make friends with maps!
Question 1
Maharashtra Board Solution
Look at the map in Fig. Compare it with the physical map of the world given in Textbook Page No. 83. Try to understand the impact of physical factors on population distribution. Complete the table accordingly. (Text book pg.no – 2)
Solution & Step-by-Step Answer:
Question 2
Maharashtra Board Solution
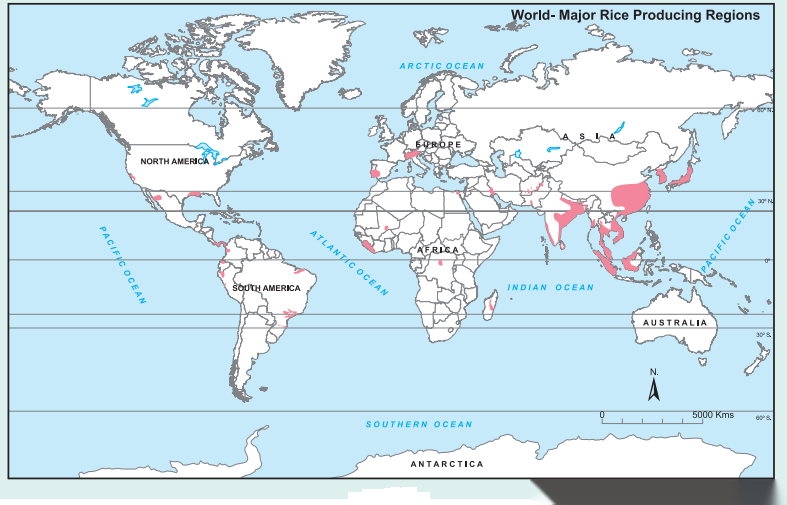
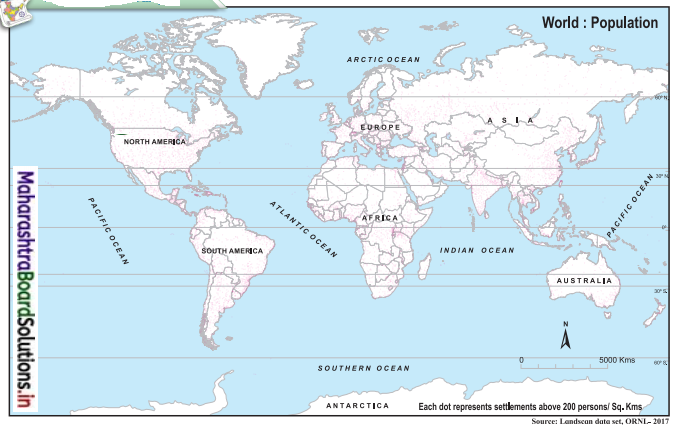
Refer to the map showing rice producing regions of the world in Fig. Relate it with the population map of the world in Fig. Write the conclusions in your own words. (Text book pg.no – 5)
Solution & Step-by-Step Answer:
Areas of high density of population in Fig 1.2 if we compare with world map Fig 1.4 showing major rice producing areas in the world, we found that the areas of major rice production and areas of high density / thick population are the same areas. Conclusion: Rice cultivation is possible only in those areas where there is fertile alluvial soil and assured supply of water. Rice producing areas and areas of dense population in the world are the river flood plains and delta of rivers like Kaveri, Krishna, Godavari and Ganga in India, Brahmaputra in Bangladesh, Irrawaddy in Myanmar, Yangtze and Yellow in China, Mekong in Laos and Cambodia etc. These areas are high density areas in the world.
Can you tell?
Question 1
Maharashtra Board Solution
Can you think of the factors besides physiography which affect the distribution of population? Make a list. (Text book pg.no – 3)
Solution & Step-by-Step Answer:
Question 2
Maharashtra Board Solution
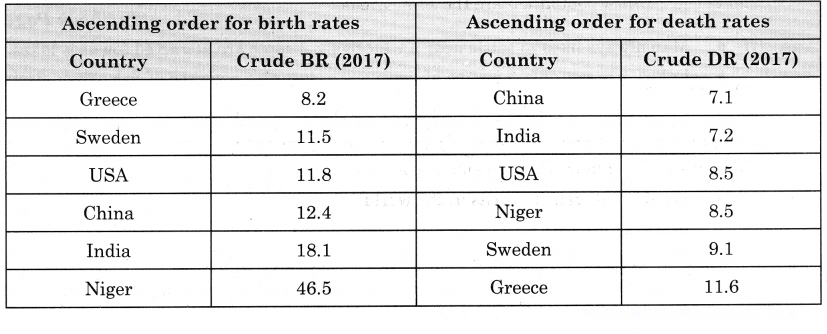
Observe the table 1.4. Arrange data in ascending order for birth rate and death rates respectively. (Text book pg.no – 8) |

Country | Crude BR (2017) | Crude DR (2017) |
Sweden | 11.5 | 9.1 |
India | 18.1 | 7.2 |
Greece | 8.2 | 11.6 |
China | 12.4 | 7.1 |
USA | 11.8 | 8.5 |
Niger | 46.5 | 8.5 |
Question 3
Maharashtra Board Solution
Look at the Fig. and
Solution & Step-by-Step Answer:
the following questions. (Text book pg.no – 9)
Answer: Find out.
Question 1
Maharashtra Board Solution
(i) Are Eskimos still living in their conventional ways? (ii) What changes can be seen in their lifestyle now? (Text book pg.no – 4)
Solution & Step-by-Step Answer:
(i) No, Eskimos are not living in their conventional way due to the changing environment as a result of increased contacts with societies to the south.
(ii) Eskimo life has changed greatly because of increased contacts with societies to the south. Use your brain power!
Question 1
Maharashtra Board Solution
(i) Can lakes be a factor for concentration of population? Find examples. (ii) Which water bodies are surrounded by dense population in Maharashtra? (Text book pg.no – 4)
Solution & Step-by-Step Answer:
(i) Man always likes to settle near a waterbody. People are attracted towards lakes.
Lakes are not only a source of fresh water but also a source of fish. They also provide water supply for industries, agriculture and provide water transport. They provide good sites to develop tourism due to greenery of trees surrounding the lake, scope for boating, cool breeze and pleasant atmosphere. For example, Lake Victoria in Africa, supports 40 million people, with population density 250 persons per sq. km. The growth rate of the population is 3.5 percent each year, which is among the highest growth rates in the world. The Victoria lake supports the largest freshwater fishery in the world. The fish catch from the lake is more than one million and it employs two lakh people in direct fishing and supports livelihood to four million people. Five Great lakes in USA – Superior, Huron, Michigan, Erie and Ontario make up the largest body of freshwater on earth. They support more than 30 million people. This equates to 10 percent of USA residents and 30 percent Canadian residents. The lakes have been a major source for transportation, trade, fishing, tourism, power, recreation etc. (ii)
Question 2
Maharashtra Board Solution
In which stage do you think India is passing right now? (Text book pg.no – 10)
Solution & Step-by-Step Answer:
India is passing through stage 3 right now.
Question 3
Maharashtra Board Solution
Find out in what multiples has population increased in the following timeline and write down your findings. For example, in the initial phase, the population took 6 centuries (1000 to 1600 A.D.) to double itself. (Text book pg.no – 11)
Solution & Step-by-Step Answer:
(i) 1000 to 1600 population increase 2 times in 6 hundred years. (ii) 1600 to 1900 population increased 3 times in 3 hundred years. (iii) 1900 to 1960 population increased 2 times in 6 hundred years. (iv) 1960 to 2000 population increased 2 times in 4 hundred years.
Let’s recall.
Question 1
Maharashtra Board Solution
Which policy did the Brazilian government promote with respect to decentralisation? (Text book pg.no – 7)
Solution & Step-by-Step Answer:
|