Balbharati Maharashtra State Board11th Commerce Maths Solution Book PdfChapter 5 Correlation Ex 5.1 Questions and Answers.
Maharashtra State Board 11th Commerce Maths Solutions Chapter 5 Correlation Ex 5.1
Question 1
Maharashtra Board Solution
Draw a scatter diagram for the data given below and interpret it.
Solution & Step-by-Step Answer:
Since all the points lie in a band rising from left to right. Therefore, there is a positive correlation between the values of X and Y respectively.


Question 2
Maharashtra Board Solution
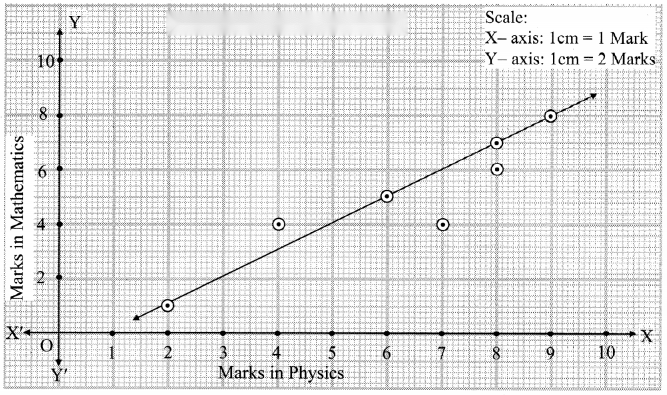
For the following data of marks of 7 students in Physics (x) and Mathematics (y), draw scatter diagram and state the type of correlation.
Solution & Step-by-Step Answer:
We take marks in Physics on X-axis and marks in Mathematics on Y-axis and plot the points as below. We get a band of points rising from left to right. This indicates the positive correlation between marks in Physics and marks in Mathematics.

Question 3
Maharashtra Board Solution
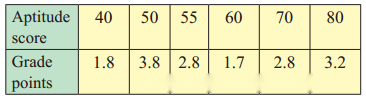
Draw a scatter diagram for the data given below. Is there any correlation between Aptitude score and Grade points?
Solution & Step-by-Step Answer:
The points are completely scattered i.e., no trend is observed. ∴ there is no correlation between Aptitude score (X) and Grade point (Y).

Question 4
Maharashtra Board Solution
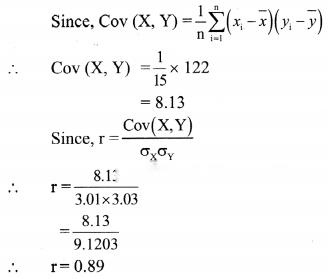
Find correlation coefficient between x andy series for the following data: n = 15, = 25, = 18, σx = 3.01, σy = 3.03, = 122
Solution & Step-by-Step Answer:
Here, n = 15, = 25, = 18, σx = 3.01, σy = 3.03, = 122
Question 5
Maharashtra Board Solution
The correlation coefficient between two variables x and y are 0.48. The covariance is 36 and the variance of x is 16. Find the standard deviation of y.
Solution & Step-by-Step Answer:
Given, r = 0.48, Cov(X, Y) = 36 Since = 16 ∴ σx = 4 ∴ the standard deviation of y is 18.75.

Question 6
Maharashtra Board Solution
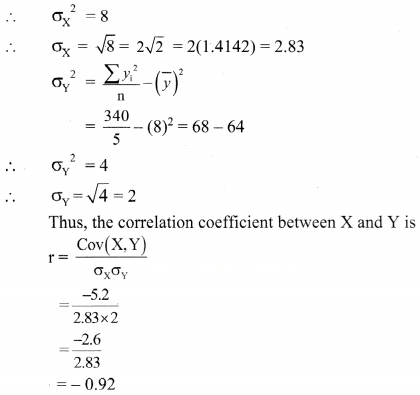
In the following data, one of the values of y is missing. Arithmetic means of x and y series are 6 and 8 respectively. (√2 = 1.4142) (i) Estimate missing observation. (ii) Calculate correlation coefficient.
Solution & Step-by-Step Answer:
(i) Let X = xi, Y = yi and missing observation be ‘a’. Given, = 6, = 8, n = 5 ∴ 8 = ∴ 40 = 35 + a ∴ a = 5 (ii) We construct the following table:


Question 7
Maharashtra Board Solution
Find correlation coefficient from the following data. [Given: √3 = 1.732]
Solution & Step-by-Step Answer:
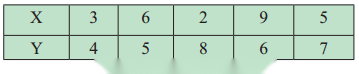
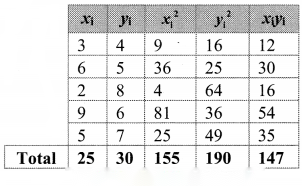
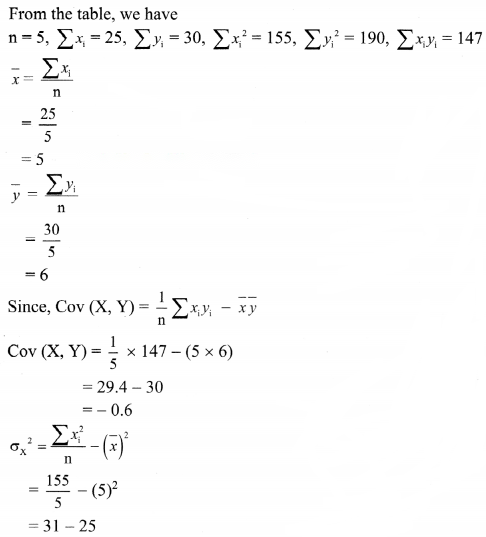
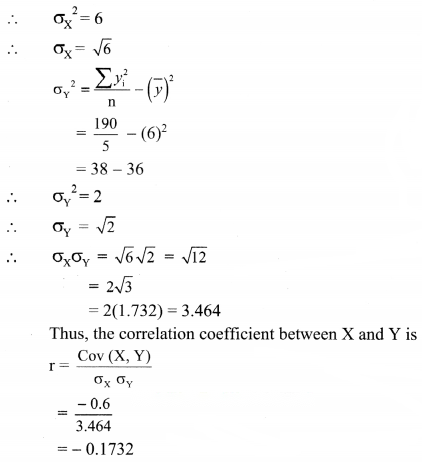
Question 8
Maharashtra Board Solution
The correlation coefficient between x and y is 0.3 and their covariance is 12. The variance of x is 9, find the standard deviation of y.
Solution & Step-by-Step Answer:
Given, r = 0.3, Cov(X, Y) = 12, = 9 ∴ = 3 ∴ the standard deviation of y is 13.33.
