Balbharati Maharashtra State Board11th Commerce Maths Solution Book PdfChapter 4 Bivariate Frequency Distribution and Chi Square Statistic Miscellaneous Exercise 4 Questions and Answers.
Maharashtra State Board 11th Commerce Maths Solutions Chapter 4 Bivariate Frequency Distribution and Chi Square Statistic Miscellaneous Exercise 4
Question 1
Maharashtra Board Solution
Following data gives the coded price (X) and demand (Y) of a commodity. Classify the data by taking classes 0 – 4, 5 – 9, etc. for X and 5 – 8, 9 – 12, etc. for Y. Also find (i) marginal frequency distribution of X and Y. (ii) conditional frequency distribution of Y when X is less than 10.
Solution & Step-by-Step Answer:
Given, X = coded price Y = demand Bivariate frequency table can be prepared by taking class intervals 0 – 4, 5 – 9,… etc for X and 5 – 8, 9 – 12,… etc for Y. Bivariate frequency distribution is as follows. (i) Marginal frequency distribution of X: Marginal frequency distribution of Y: (ii) Conditional frequency distribution of Y when X < 10:


Question 2
Maharashtra Board Solution
Following data gives the age in years and marks obtained by 30 students in an intelligence test. Prepare a bivariate frequency distribution by taking class intervals 16 – 18, 18 – 20,…,etc. for age and 10 – 20, 20 – 30,…, etc. for marks. Find (i) marginal frequency distributions. (ii) conditional frequency distribution of marks obtained when age of students is between 20 – 22.
Solution & Step-by-Step Answer:
Let X = Age in years Y = Marks Bivariate frequency table can be prepared by taking class intervals 16 – 18, 18 – 20,…, etc for X and 10 – 20, 20 – 30,…, etc for Y. Bivariate frequency distribution is as follows: (i) Marginal frequency distribution of X: Marginal frequency distribution of Y: (ii) Conditional frequency distribution of Y when X is between 20 – 22:


Question 3
Maharashtra Board Solution
Following data gives Sales (in Lakh ?) and Advertisement Expenditure (in Thousand ₹) of 20 firms. (115, 61) (120, 60) (128, 61) (121, 63) (137, 62) (139, 62) (143, 63) (117, 65) (126, 64) (141, 65) (140, 65) (153, 64) (129, 67) (130, 66) (150, 67) (148, 66) (130, 69) (138, 68) (155, 69) (172, 68) (i) Construct a bivariate frequency distribution table for the above data by taking classes 115 – 125, 125 – 135, ….etc. for sales and 60 – 62, 62 – 64, …etc. for advertisement expenditure. (ii) Find marginal frequency distributions (iii) Conditional frequency distribution of Sales when the advertisement expenditure is between 64 – 66 (Thousand ₹) (iv) Conditional frequency distribution of advertisement expenditure when the sales are between 125 – 135 (lakh ₹)
Solution & Step-by-Step Answer:
(i) Let X = Sales (in lakh ₹) Y = Advertisement Expenditure (in Thousand ₹) Bivariate frequency table can be prepared by taking class intervals 115 – 125, 125 – 135, …. etc for X and 60 – 62, 62 – 64, ….etc for Y. Bivariate frequency distribution is as follows: (ii) Marginal frequency distribution of X: Marginal frequency distribution of Y: (ii) Conditional frequency distribution of X when Y is between 64 – 66: (iii) Conditional frequency distribution of Y when X is between 125 – 135:




Question 4
Maharashtra Board Solution
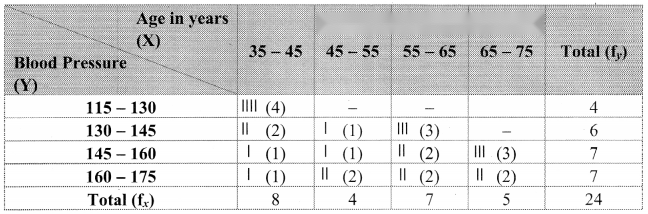
Prepare a bivariate frequency distribution for the following data, taking class intervals for X as 35 – 45, 45 – 55, …. etc and for Y as 115 – 130, 130 – 145, … etc where, X denotes the age in years and Y denotes blood pressure for a group of 24 persons. (55, 151) (36, 140) (72, 160) (38, 124) (65, 148) (46, 130) (58, 152) (50, 149) (38, 115) (42, 145) (41, 163) (47, 161) (69, 159) (60, 161) (58, 131) (57, 136) (43, 141) (52, 164) (59, 161) (44, 128) (35, 118) (62, 142) (67, 157) (70, 162) Also find (i) Marginal frequency distribution of X. (ii) Conditional frequency distribution of Y when X < 45.
Solution & Step-by-Step Answer:
Given X = Age in years Y = Blood pressure Bivariate frequency table can be prepared by taking class intervals 35 – 45, 45 – 55, …, etc for X and 115 – 130, 130 – 145, ….., etc for Y. Bivariate frequency distribution is as follows: (i) Marginal frequency distribution of X: (ii) Conditional frequency distribution of Y when X < 45:


Question 5
Maharashtra Board Solution
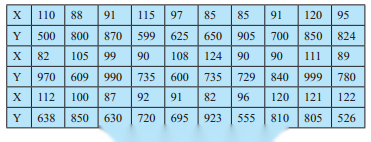
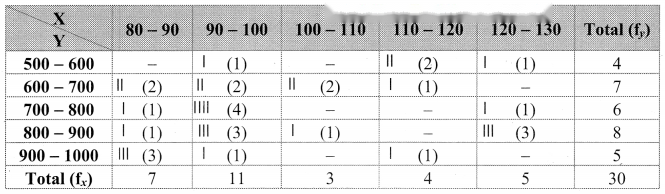
Thirty pairs of values of two variables X and Y are given below. Form a bivariate frequency table. Also find marginal frequency distributions of X and Y.
Solution & Step-by-Step Answer:
Bivariate frequency table can be prepared by taking class intervals 80 – 90, 90 – 100, etc for X and 500 – 600, 600 – 700, …., etc for Y. Bivariate frequency distribution is as follows: Marginal frequency distribution of X: Marginal frequency distribution of Y


Question 6
Maharashtra Board Solution
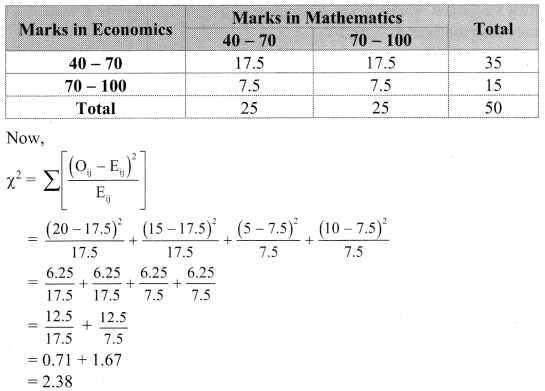
The following table shows how the samples of Mathematics and Economics scores of 25 students are distributed: Find the value of ϰ2 statistic.
Solution & Step-by-Step Answer:
Table of observed frequencies. Expected frequencies are given by Eij = E11 = = 17.5 E12 = = 17.5 E21 = = 7.5 E22 = = 7.5 Table of expected frequencies.


Question 7
Maharashtra Board Solution
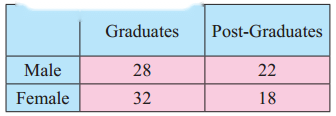
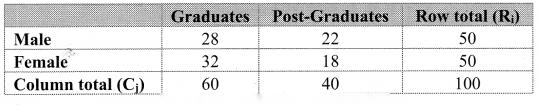
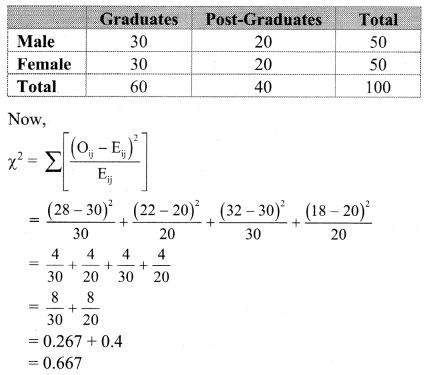
Compute ϰ2 statistic from the following data:
Solution & Step-by-Step Answer:
Table of observed frequencies. Expected frequencies are given by Eij = E11 = = 30 E12 = = 20 E21 = = 30 E22 = = 20 Table of expected frequencies.
Question 8
Maharashtra Board Solution
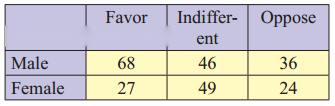
The attitude of 250 employees towards a proposed policy of the company is as observed in the following table. Calculate ϰ2 statistic.
Solution & Step-by-Step Answer:
Table of observed frequencies Expected frequencies are given by Eij = E11 = = 57 E12 = = 57 E13 = = 36 E21 = = 38 E22 = = 38 E23 = = 24 Table of observed frequencies.


Question 9
Maharashtra Board Solution
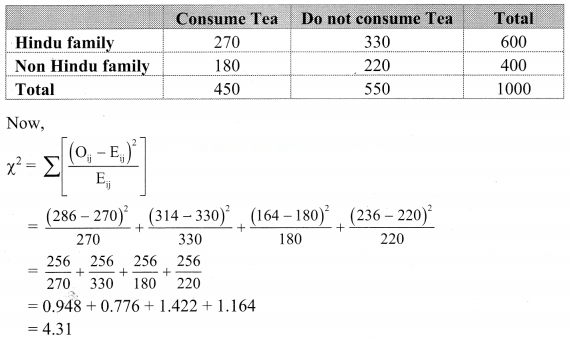
In a certain sample of 1000 families, 450 families are consumers of tea. Out of 600 Hindu families, 286 families consume tea. Calculate ϰ2 statistic.
Solution & Step-by-Step Answer:
The given data can be arranged in the following table. Table of observed frequencies. Expected frequencies are given by Eij = E11 = = 270 E12 = = 330 E21 = = 180 E22 = = 220 Table of expected frequencies.


Question 10
Maharashtra Board Solution
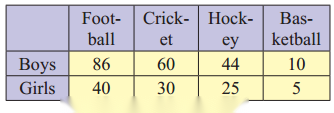
A sample of boys and girls were asked to choose their favourite sport, with the following results. Find the value of ϰ2 statistic.
Solution & Step-by-Step Answer:
Table of observed frequencies. Expected frequencies are given by Eij = E11 = = 84 E12 = = 60 E13 = = 46 E14 = = 10 E21 = = 42 E22 = = 30 E23 = = 23 E24 = = 5 Table of expected frequencies.