Balbharati Maharashtra State Board11th Commerce Maths Solution Book PdfChapter 1 Partition Values Ex 1.1 Questions and Answers.
Maharashtra State Board 11th Commerce Maths Solutions Chapter 1 Partition Values Ex 1.1
Question 1
Maharashtra Board Solution
Compute all the quartiles for the following series of observations: 16, 14.9, 11.5, 11.8, 11.1, 14.5, 14, 12, 10.9, 10.7, 10.6, 10.5, 13.5, 13, 12.6
Solution & Step-by-Step Answer:
The given data can be arranged in ascending order as follows: 10.5, 10.6, 10.7, 10.9, 11.1, 11.5, 11.8, 12, 12.6, 13, 13.5, 14, 14.5, 14.9, 16 Here, n = 15 Q1 = value of observation = value of observation = value of 4th observation ∴ Q1 = 10.9 Q2 = value of 2 observation = value of 2 observation = value of (2 × 4)th observation = value of 8th observation ∴ Q2 = 12 Q3 = value of 3 observation = value of 3 observation = value of (3 × 4)th observation = value of 12th observation ∴ Q3 = 14
Question 2
Maharashtra Board Solution
The heights (in cm.) of 10 students are given below: 148, 171, 158, 151, 154, 159, 152, 163, 171, 145 Calculate Q1 and Q3 for the above data.
Solution & Step-by-Step Answer:
The given data can be arranged in ascending order as follows: 145, 148, 151, 152, 154, 158, 159, 163, 171, 171 Here, n = 10 Q1 = value of observation = value of observation = value of (2.75)th observation = value of 2nd observation + 0.75 (value of 3rd observation – value of 2nd observation) = 148 + 0.75 (151 – 148) = 148 + 0.75(3) = 148 + 2.25 ∴ Q1 = 150.25 Q3 = value of 3 observation = value of 3 observation = value of (3 × 2.75)th observation = value of (8.25)th observation = value of 8th observation + 0.25 (value of 9th observation – value of 8th observation) = 163 + 0.25(171 – 163) = 163 + 0.25(8) = 163 + 2 ∴ Q3 = 165
Question 3
Maharashtra Board Solution
The monthly consumption of electricity (in units) of families in a certain locality is given below: 205, 201, 190, 188, 195, 172, 210, 225, 215, 232, 260, 230 Calculate electricity consumption (in units) below which 25% of the families lie.
Solution & Step-by-Step Answer:
To find the consumption of electricity below which 25% of the families lie, we have to find Q1. Monthly consumption of electricity (in units) can be arranged in ascending order as follows: 172, 188, 190, 195, 201, 205, 210, 215, 225, 230, 232, 260. Here, n = 12 Q1 = value of observation = value of observation = value of (3.25)th observation = value of 3rd observation + 0.25 (value of 4th observation – value of 3rd observation) = 190 + 0.25(195 – 190) = 190 + 0.25(5) = 190 + 1.25 = 191.25 ∴ the consumption of electricity below which 25% of the families lie is 191.25.
Question 4
Maharashtra Board Solution
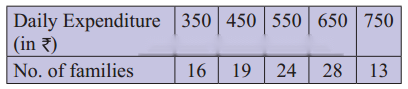
For the following data of daily expenditure of families (in ₹), compute the expenditure below which 75% of families include their expenditure.
Solution & Step-by-Step Answer:
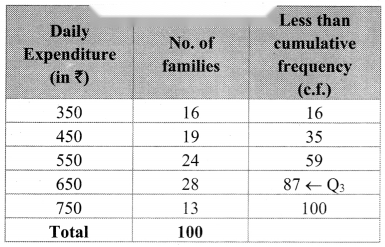
To find the expenditure below which 75% of families have their expenditure, we have to find Q3. We construct the less than cumulative frequency table as given below: Here, n = 100 Q3 = value of 3 observation = value of 3 observation = value of (3 × 25.25)th observation = value of (75.75)th observation Cumulative frequency which is just greater than (or equal to) 75.75 is 87. ∴ Q3 = 650 ∴ the expenditure below which 75% of families include their expenditure is ₹ 650.
Question 5
Maharashtra Board Solution
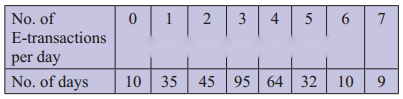
Calculate all the quartiles for the following frequency distribution:
Solution & Step-by-Step Answer:
We construct the less than cumulative frequency table as given below: Here, n = 300 Q1 = value of observation = value of observation = value of (75.25)th observation Cumulative frequency which is just greater than (or equal to) 75.25 is 90. ∴ Q1 = 2 Q2 = value of 2 observation = value of 2 observation = value of (2 × 75.25)th observation = value of (150.50)th observation ∴ Cumulative frequency which is just greater than (or equal to) 150.50 is 185. ∴ Q2 = 3 Q3 = value of 3 observation = value of 3 observation = value of (3 × 75.25)th observation = value of (225.75)th observation Cumulative frequency which is just greater than (or equal to) 225.75 is 249. ∴ Q3 = 4

Question 6
Maharashtra Board Solution
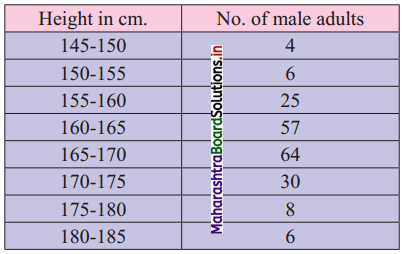
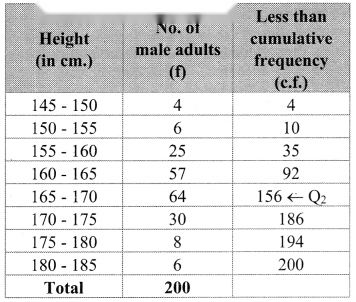
The following is the frequency distribution of heights of 200 male adults in a factory: Find the central height.
Solution & Step-by-Step Answer:
To find the central height, we have to find Q2. We construct the less than cumulative frequency table as given below: Here, N = 200 Q2 class = class containing observation ∴ = 100 Cumulative frequency which is just greater than (or equal to) 100 is 156. ∴ Q2 lies in the class 165 – 170. ∴ L = 165, h = 5, f = 64, c.f. = 92 Q2 = = 165 + (100 – 92) = 165 + × 8 = 165 + = 165 + 0.625 = 165.625 ∴ Central height is 165.625 cm.
Question 7
Maharashtra Board Solution
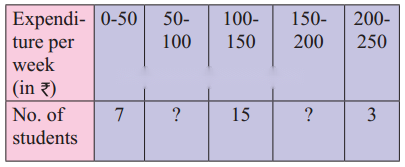
The following is the data of pocket expenditure per week of 50 students in a class. It is known that the median of the distribution is ₹ 120. Find the missing frequencies.
Solution & Step-by-Step Answer:
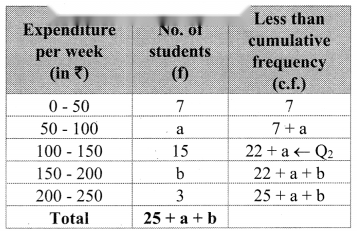
Let a and b be the missing frequencies of class 50 – 100 and class 150 – 200 respectively. We construct the less than cumulative frequency table as given below: Here, N = 25 + a + b Since, N = 50 ∴ 25 + a + b = 50 ∴ a + b = 25 …..(i) Given, Median = Q2 = 120 ∴ Q2 lies in the class 100 – 150. ∴ L = 100, h = 50, f = 15, = 25 ∴ Q2 = ∴ 120 = 100 + [25 – (7 + a)] ∴ 120 – 100 = (25 – 7 – a) ∴ 20 = (18 – a) ∴ = 18 – a ∴ 6 = 18 – a ∴ a = 18 – 6 = 12 Substituting the value of a in equation (i), we get 12 + b = 25 ∴ b = 25 – 12 = 13 ∴ 12 and 13 are the missing frequencies of the class 50 – 100 and class 150 – 200 respectively.
Question 8
Maharashtra Board Solution
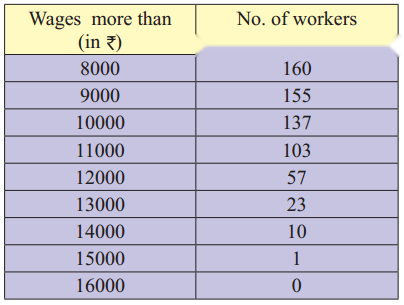
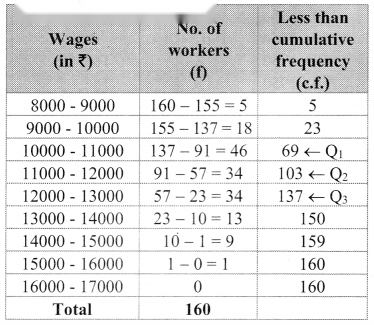
The following is the distribution of 160 workers according to the wages in a certain factory: Determine the values of all quartiles and interpret the results.
Solution & Step-by-Step Answer:
The given table is a more than cumulative frequency. We transform the given table into less than cumulative frequency. We construct the less than cumulative frequency table as given below: Here, N = 160 ∴ Q1 class = class containing observation ∴ = 40 Cumulative frequency which is just greater than (or equal to) 40 is 69. ∴ Q1 lies in the class 10000 – 11000 ∴ L = 10000, h = 1000, f = 46, c.f. = 23 Q1 = = 10000 + (40 – 23) = 10000 + (17) = 10000 + = 10000 + 369.57 = 10369.57 Q2 class = class containing observation ∴ = 80 Cumulative frequency which is just greater than (or equal to) 80 is 103. ∴ Q2 lies in the class 11000 – 12000. ∴ L = 11000, h = 1000, f = 34, c.f. = 69 ∴ Q2 = = 11000 + (80 – 69) = 11000 + (11) = 11000 + = 11000 + 323.529 = 11323.529 Q3 class = class containing observation ∴ = 120 Cumulative frequency which is just greater than (or equal to) 120 is 137. ∴ Q3 lies in the class 12000 – 13000. ∴ L = 12000, h = 1000, f = 34, c.f. = 103 ∴ Q3 = = 12000 + (120 – 103) = 12000 + (17) = 12000 + = 12000 + 500 = 12500 Interpretation: Q1 < Q2 < Q3
Question 9
Maharashtra Board Solution
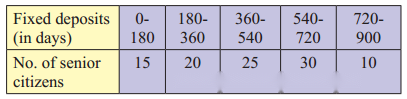
Following is grouped data for the duration of fixed deposits of 100 senior citizens from a certain bank: Calculate the limits of fixed deposits of central 50% senior citizens.
Solution & Step-by-Step Answer:
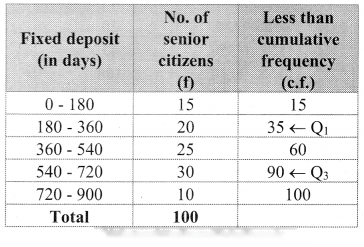
We construct the less than cumulative frequency table as given below: To find the limits of fixed deposits of central 50% senior citizens, we have to find Q1 and Q3. Here, N = 100 Q1 class = class containing observation ∴ = 25 Cumulative frequency which is just greater than (or equal to) 25 is 35. ∴ Q1 lies in the class 180 – 360. ∴ L = 180, h = 180, f = 20, c.f. = 15 ∴ Q1 = = 180 + (25 – 15) = 180 + 9(10) = 180 + 90 ∴ Q1 = 270 Q3 class = class containing observation ∴ = 75 Cumulative frequency which is just greater than (or equal to) 75 is 90. ∴ Q3 lies in the class 540 – 720. ∴ L = 540, h = 180, f = 30, c.f. = 60 ∴ Q3 = = 540 + (75 – 60) = 540 + 6(15) = 540 + 90 ∴ Q3 = 630 ∴ Limits of duration of fixed deposits of central 50% senior citizens is from 270 to 630.
Question 10
Maharashtra Board Solution
Find the missing frequency given that the median of the distribution is 1504.
Solution & Step-by-Step Answer:
Let x be the missing frequency of the class 1550 – 1750. We construct the less than frequency table as given below: Here, N = 199 + x Given, Median (Q2) = 1504 ∴ Q2 lies in the class 1350 – 1550. ∴ L = 1350, h = 200, f = 100, c.f. = 63, ∴ Q2 = ∴ 1504 = 1350 + ∴ 1504 – 1350 = 2 ∴ 154 = 199 + x – 126 ∴ 154 = x + 73 ∴ x = 81

