Latest Maharashtra State Board (SSC & HSC) 2026-27 Syllabus Digest & Solutions Updated!
Class 9 (SSC)Geography2026-27 Syllabus

Chapter 1 Distributional Maps Solutions

Complete Maharashtra State Board Balbharati & Yuvakbharati textbook solutions for Chapter 1 Distributional Maps. Step-by-step solved exercises, numerical problems, and digest answers.

70 Solved Questions8 Diagrams2528 words

Maharashtra State Board Class 9 Geography Solutions Chapter 1 Distributional Maps

Class 9 Geography Chapter 1 Distributional Maps Textbook Questions and Answers

1. Give reasons why the following sentences are right or wrong:

Geography Class 9 Chapter 1 Distributional Maps Question 1.
The main aim of distributional maps is to show location.
Answer:
Wrong The main aim of distributional maps is to show the distribution of variables like temperature, rainfall, population, etc.

Thus, the main aim of distributional maps is to show the distribution of variables in a particular region.

Distributional Maps Class 9 Question 2.
In choropleth maps, only one value is assigned to the sub-administrative unit.
Answer:
Right

Thus, in choropleth maps, only one value is assigned to sub administrative unit.

Distributional Maps Questions And Answers Question 3.
In choropleth maps, colours/tints do not change according to the values of the variables.
Answer:
Wrong.
In choropleth maps, colours/tints change according to the values of variables.

Distributional Map Question 4.
Choropleth maps are used to show altitudes.
Answer:
Wrong.
Isopleth maps and not the choropleth maps are used to show altitude.

Question 5 Maharashtra Board Solution
Isopleth maps are used to show population distribution.
Solution & Step-by-Step Answer:
Wrong. Dot method maps or choropleth method maps are used to show population distribution
Question 6 Maharashtra Board Solution
In dot method, every dot should have an appropriate scale.
Solution & Step-by-Step Answer:
Right. The size of the dot is decided as per the value of a variable that is freely scattered across the region.
Question 7 Maharashtra Board Solution
Isopleth maps are not made using isolines.
Solution & Step-by-Step Answer:
Wrong. Isopleth maps are made using isolines.
Question 8 Maharashtra Board Solution
Distribution of various geographical elements can be shown using dot method.
Solution & Step-by-Step Answer:
Wrong. Distribution of various geographical elements cannot be shown using dot method.

2. Answer in brief.

Question 1 Maharashtra Board Solution
Explain the use and types of distributional maps.
Solution & Step-by-Step Answer:
(a) Use of distributional maps: The distributional maps are useful for explaining the patterns of distribution of a particular geographical variable. (b) The types of distributional maps : The following are the types of distributional maps.
Question 2 Maharashtra Board Solution
Differentiate between choropleth and isopleths methods.
Solution & Step-by-Step Answer:

Choropleth Method

Isopleth Method

(1) In Choropleth method maps, the distribution of various variables are shown by shading or using tints of the same colour.

(1) In Isopleth method maps, the distribution of various variables are shown with the help of isolines.

(2) When the distribution of a variable is not continuous, the choropleth method is used.

(2) When the distribution of a variable is continuous, the isopleth method is used.

(3) Choropleth method is used to show population density, cattle distribution etc.

(3) Isopleth method are used to show altitude, temperature, rainfall of a region etc.

Question 3 Maharashtra Board Solution
Explain with reasons the method which is best suited to show the distribution of population in a region.
Solution & Step-by-Step Answer:

3. Which method will you use for the following information?

Question 1 Maharashtra Board Solution
Talukawise wheat production in the district
Solution & Step-by-Step Answer:
Dot method
Question 2 Maharashtra Board Solution
Distribution of the altitude of the land in the district.
Solution & Step-by-Step Answer:
Isopleth method
Question 3 Maharashtra Board Solution
Distribution of domestic animals in the State
Solution & Step-by-Step Answer:
Dot method
Question 4 Maharashtra Board Solution
The distribution of population density in India
Solution & Step-by-Step Answer:
Choropleth method
Question 5 Maharashtra Board Solution
Temperature distribution in Maharashtra State.
Solution & Step-by-Step Answer:
Isopleth method

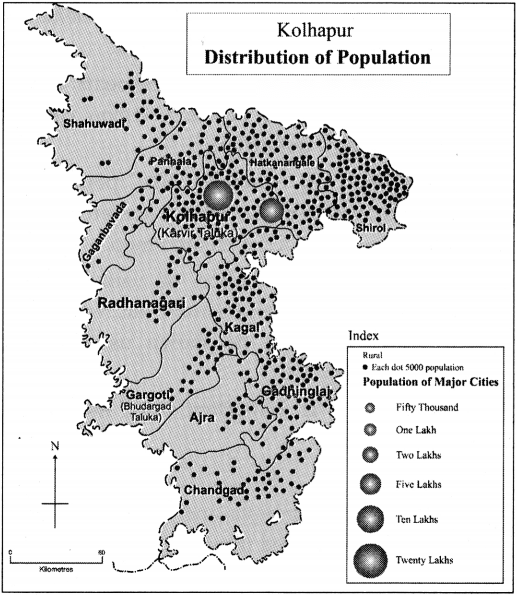
4. Study the population distribution map of Kolhapur district and answer the following questions:

Question 1 Maharashtra Board Solution
Which method has been used to show the distribution of population in the district?
Solution & Step-by-Step Answer:
The dot method has been used to show the distribution of population in the district.
Question 2 Maharashtra Board Solution
Explain the direction wise distribution of the population from dense to sparse.
Solution & Step-by-Step Answer:
The distribution of the population is dense in the Eastern part of the district, whereas the western part of the district has low density of population.
Question 3 Maharashtra Board Solution
What is the population shown by the largest circle? Which place is that?
Solution & Step-by-Step Answer:
The population shown by the largest circle is nearly 20 lakhs. That place is Kolhapur city (Karvir Taluka)
Question 4 Maharashtra Board Solution
Which Taluka has the least population?
Solution & Step-by-Step Answer:
Gaganbavada Taluka has the least population.

Class 9 Geography Chapter 1 Distributional Maps Intext Questions and Answers

Make friends with maps!
Read the map given below and answer the Questions:
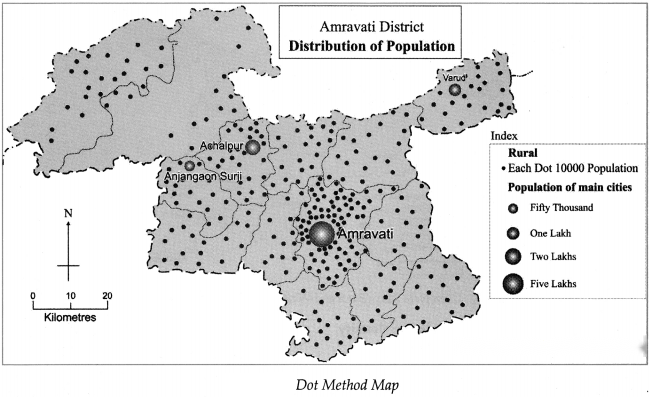
Question 1 Maharashtra Board Solution
What is the population of the Amravati town?
Solution & Step-by-Step Answer:
The population of the Amravati town is nearly 5 lakhs.
Question 2 Maharashtra Board Solution
Name the place having population of 1 lakh on the map.
Solution & Step-by-Step Answer:
Achalpur has a population of 1 lakh
Question 3 Maharashtra Board Solution
Which part of the map shows sparse distribution of population?
Solution & Step-by-Step Answer:
The northwestern part of the map shows sparse distribution of population

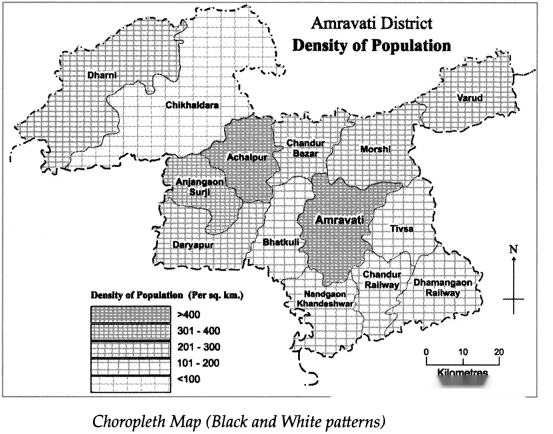
Read the map given below and answer the Questions:

Question 1 Maharashtra Board Solution
Name the talukas having population density between 301 and 400 persons per sq km.
Solution & Step-by-Step Answer:
Anjangao Surji has population density between 301 and 400 persons per sq km
Question 2 Maharashtra Board Solution
What is the density of the Amravati taluka?
Solution & Step-by-Step Answer:
Amravati taluka has the population density of more than 400 persons per sq km
Question 3 Maharashtra Board Solution
Name the talukas having population density less than 300 persons per sq km.
Solution & Step-by-Step Answer:
Dharini, Chikaldhara, Daryapur, Chandur Bazar, Morshi, Varud, Tivsa, Dhamangaon Railway, Nandgaon Khandeshwar and Bhatkuli have population density less than 300 persons per sq km.
Question 4 Maharashtra Board Solution
Which taluka has a population density of less than 100 persons per sq km?
Solution & Step-by-Step Answer:
Chikaldhara has population density of less than 100 persons per sq km.
Question 5 Maharashtra Board Solution
Which Talukas have a population density of more than 400 persons per sq km?
Solution & Step-by-Step Answer:
Amravati and Achalpur have the population density of more than 400 persons per sq km.

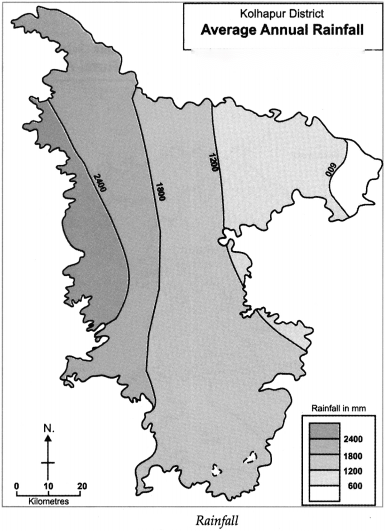
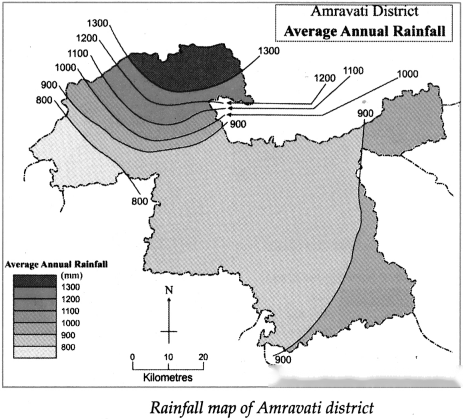
Read the map given below and answer the Questions:
Question 1 Maharashtra Board Solution
In which part of the district is the rainfall more?
Solution & Step-by-Step Answer:
Rainfall is more in the Northern part of the district.
Question 2 Maharashtra Board Solution
In which direction is the rainfall decreasing?
Solution & Step-by-Step Answer:
Rainfall is decreasing towards the west
Question 3 Maharashtra Board Solution
What is the lowest value of the rainfall in the district?
Solution & Step-by-Step Answer:
The lowest value of the rainfall in the district is less than 800 mm.
Question 4 Maharashtra Board Solution
What is the highest value of the rainfall in the district?
Solution & Step-by-Step Answer:
The highest value of the rainfall in the district is more than 1300 mm.
Question 5 Maharashtra Board Solution
What is the amount of rainfall in the central part of the district?
Solution & Step-by-Step Answer:
The amount of rainfall in the central part of the district is 900 mm.

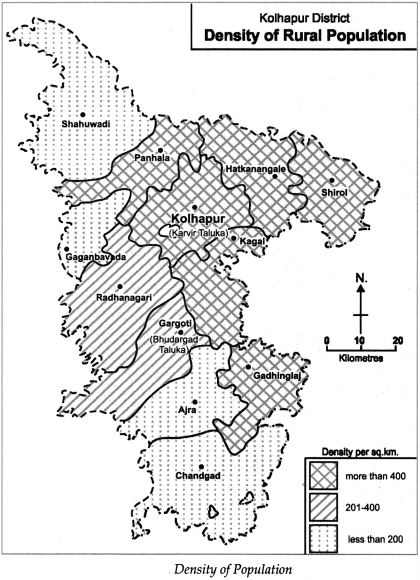
Read the map given below and answer the Questions:
Question 1 Maharashtra Board Solution
In which direction is the density of population decreasing?
Solution & Step-by-Step Answer:
The density of population is decreasing towards the North and South direction.
Question 2 Maharashtra Board Solution
Name the talukas with a population density less than 200.
Solution & Step-by-Step Answer:
Shahuwadi, Gaganbavada, Ajra and Chandgad have a population density of less than 200.
Question 3 Maharashtra Board Solution
Name the talukas having population density between 200 and 400.
Solution & Step-by-Step Answer:
Radhanagri and Gargoti have population density between 200 and 400.
Question 4 Maharashtra Board Solution
Name the talukas with a population density more than 400.
Solution & Step-by-Step Answer:
Kolhapur, Panhala, Hatkanangale, Shirol, Gadhinglaj and Kagal have population density more than 400.
Question 5 Maharashtra Board Solution
In which direction are the talukas having a higher density of population located in the district?
Solution & Step-by-Step Answer:
The Eastern part of Kolhapur has a higher density of population.
Question 6 Maharashtra Board Solution
Which method has been used in the making of this map?
Solution & Step-by-Step Answer:
Choropleth method is used in making this map.

Read the map given below and answer the Questions:
Question 1 Maharashtra Board Solution
In which direction is the rainfall more in the district?
Solution & Step-by-Step Answer:
The rainfall is more in the Western part of the district.
Question 2 Maharashtra Board Solution
In which direction is the rainfall decreasing?
Solution & Step-by-Step Answer:
The rainfall is decreasing towards the East.
Question 3 Maharashtra Board Solution
Which class shows low rainfall category in the district?
Solution & Step-by-Step Answer:
O to 600 mm class shows low rainfall category in the district.
Question 4 Maharashtra Board Solution
Which class shows high rainfall category in the district?
Solution & Step-by-Step Answer:
More than 2400 (2400 to 3000 mm) class shows high rainfall category in the district.
Question 5 Maharashtra Board Solution
Which method has been used in making this map?
Solution & Step-by-Step Answer:
The Isopleth method has been used in making this map

Study the population distribution map of Kolhapur district and answer the following questions:
Question 1 Maharashtra Board Solution
A field visit is an important study method in Geography.
Solution & Step-by-Step Answer:
Right.

Class 9 Geography Chapter 1 Distributional Maps Additional Important Questions and Answers

Complete the statements choosing the correct option:

Question 1 Maharashtra Board Solution
The main aim of distributional maps is to show the location of the place and of variables. (a) population (b) statistics (c) consumption (d) distribution
Solution & Step-by-Step Answer:
(d) distribution
Question 2 Maharashtra Board Solution
Distributional maps are of types. (a) two (b) three (c) four (d) five
Solution & Step-by-Step Answer:
(b) three
Question 3 Maharashtra Board Solution
To draw distributional maps, we need data. (a) statistical (b) population (c) colourful (d) distance
Solution & Step-by-Step Answer:
(a) statistical
Question 4 Maharashtra Board Solution
The distribution of population is shown by method. (a) dot (b) choropleth (c) isopleth (d) isolines
Solution & Step-by-Step Answer:
(a) dot
Question 5 Maharashtra Board Solution
In maps, the data regarding various geographical variables are shown by shading or tints of various colours. (a) dot (b) choropleth, (c) isopleth (d) thematic
Solution & Step-by-Step Answer:
(b) choropleth
Question 6 Maharashtra Board Solution
When the distribution of a variable is discontinuous the map is used. (a) isopleth (b) physical (c) choropleth (d) dot
Solution & Step-by-Step Answer:
(c) choropleth
Question 7 Maharashtra Board Solution
In method, lines showing equal values are used. (a) choropleth (b) isopleth (c) dot (d) planar
Solution & Step-by-Step Answer:
(b) isopleth
Question 8 Maharashtra Board Solution
When the distribution of a variable is the isopleth method is used. (a) continuous (b) discontinuous (c) sparse (d) disjoint
Solution & Step-by-Step Answer:
(a) continuous
Question 9 Maharashtra Board Solution
While showing population distribution, urban population is shown by (a) circles (b) dots (c) squares (d) lines
Solution & Step-by-Step Answer:
(a) circles
Question 10 Maharashtra Board Solution
is an important study method in Geography. (a) Maps (b) Field visit (c) Picnic (d) farm visit
Solution & Step-by-Step Answer:
(b) Field visit

Match the column.

Question 1 Maharashtra Board Solution

Group A

Group B

(1) Dot method

(a) distribution of temperature

(2) Choropleth method

(b) distribution of cotton crop

(3) Isopleth method

(c) density of population

Solution & Step-by-Step Answer:

(1 – b),
(2 – c),
(3 – a)

Question 2 Maharashtra Board Solution

Group A

Group A

(1) Dot method
(2) Choropleth method
(3) Isopleth method

(a) variables are freely scattered
(b) distribution of the variable is continuous
(c) distribution of the variable is shown in sub administrative unit

Solution & Step-by-Step Answer:
(1 – a),
(2 – c),
(3 – b)

Answer in one sentence:

Question 1 Maharashtra Board Solution
What are distributional maps?
Solution & Step-by-Step Answer:
Maps that show the distribution of various geographical variables are called ‘distributional maps’.
Question 2 Maharashtra Board Solution
What are thematic maps? Ans, Maps that are prepared with special themes are called ‘thematic maps’.

Question 3 Maharashtra Board Solution
What is a dot-method map?
Solution & Step-by-Step Answer:
block bg-white dark:bg-slate-900/80 border-l-4 border-emerald-500 rounded-r-xl p-5 my-3 shadow-xs border border-slate-200/60 dark:border-slate-800">
Solution & Step-by-Step Answer:
A dot method map is a map type, that shows the distribution of a variable using dot symbols.
Question 4 Maharashtra Board Solution
What is a choropleth method map?
Solution & Step-by-Step Answer:
A choropleth method map is a map type, in which the distribution of a variable is shown by shades or tint of various colours.
Question 5 Maharashtra Board Solution
When do we use the isopleth method for showing the distribution of a variable on a map?
Solution & Step-by-Step Answer:
We use the isopleth method for showing the distribution of a variable on a map, when the distribution of the variable is continuous.
Question 6 Maharashtra Board Solution
What is an isopleth method map?
Solution & Step-by-Step Answer:
An isopleth method map, is a map type, that shows distribution of a variable with the help of lines showing equal values.
Question 7 Maharashtra Board Solution
What is point related data?
Solution & Step-by-Step Answer:
The statistical data of particular variables with respect to various places is called ‘point-related data’.
Question 8 Maharashtra Board Solution
Which elements are generally studied in a geographical field visit?
Solution & Step-by-Step Answer:
The various elements which can be studied during geographical field visits include physical landforms, river banks, dams, coastal areas, tourism sites, offices or museums related to geographical elements, villages, forest areas etc.
Question 9 Maharashtra Board Solution
Mention the list of things to be carried while going on a geographical field visit?
Solution & Step-by-Step Answer:
The various things which one should carry to a geographical field visit include notebook, specimen Questionnaire, pen pencil, scale, tape, compass, bag for collecting samples, maps, camera, etc.
Question 10 Maharashtra Board Solution
What is field report?
Solution & Step-by-Step Answer:
The report written on the basis of the information obtained from a field visit is known as field report.

Which method will you use for the following information:

Question 1 Maharashtra Board Solution
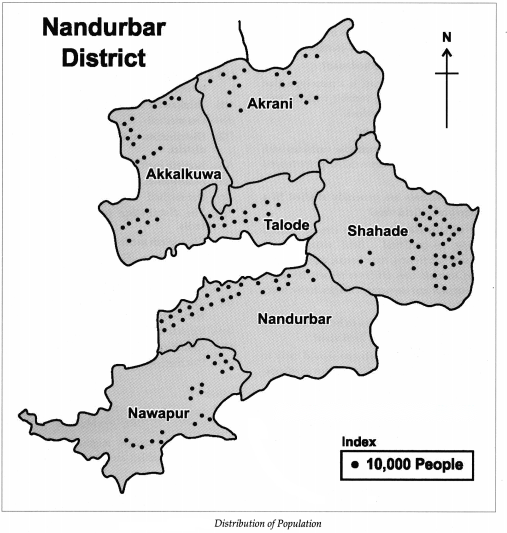
The distribution of rainfall in the district of Nandurbar.
Solution & Step-by-Step Answer:
Isopleth Method
Question 2 Maharashtra Board Solution
Cotton crop distribution in Maharashtra.
Solution & Step-by-Step Answer:
Dot method
Question 3 Maharashtra Board Solution
Draw a map using the Dot Method:
Solution & Step-by-Step Answer:

Explain:

Question 1 Maharashtra Board Solution
Choropleth method
Solution & Step-by-Step Answer:
Question 2 Maharashtra Board Solution
Preparations for field visit
Solution & Step-by-Step Answer:
Question 3 Maharashtra Board Solution
Selection of the study area
Solution & Step-by-Step Answer:
Question 4 Maharashtra Board Solution
Report writing
Solution & Step-by-Step Answer: