Balbharati Maharashtra State Board12th Commerce Maths Digest PdfChapter 4 Time Series Miscellaneous Exercise 4 Questions and Answers.
Maharashtra State Board 12th Commerce Maths Solutions Chapter 4 Time Series Miscellaneous Exercise 4
(I) Choose the correct alternative.
Question 1
Maharashtra Board Solution
Which of the following can’t be a component of a time series? (a) Seasonality (b) Cyclical (c) Trend (d) Mean
Solution & Step-by-Step Answer:
(d) Mean
Question 2
Maharashtra Board Solution
The first step in time series analysis is to (a) Perform regression calculations (b) Calculate a moving average (c) Plot the data on a graph (d) Identify seasonal variation
Solution & Step-by-Step Answer:
(c) Plot the data on a graph
Question 3
Maharashtra Board Solution
Time-series analysis is based on the assumption that (a) Random error terms are normally distributed. (b) The variable to be forecast and other independent variable are correlated. (c) Past patterns in the variable to be forecast will continue unchanged into the future. (d) The data do not exhibit a trend.
Solution & Step-by-Step Answer:
(c) Past patterns in the variable to be forecast will continue unchanged into the future.
Question 4
Maharashtra Board Solution
Moving averages are useful in identifying (a) Seasonal component (b) Irregular component (c) Trend component (d) Cyclical component
Solution & Step-by-Step Answer:
(c) Trend component
Question 5
Maharashtra Board Solution
We can use regression line for past data to forecast future data. We then use the line which (a) Minimizes the sum of squared deviations of past data from the line. (b) Minimizes the sum of deviations of past data from the line. (c) Maximizes the sum of squared deviations of past data from the line. (d) Maximizes the sum of deviation of past data from the line.
Solution & Step-by-Step Answer:
(a) Minimizes the sum of squared deviations of past data from the line
Question 6
Maharashtra Board Solution
Which of the following is a major problem for forecasting, especially when using the method of least squares? (a) The past cannot be known (b) The future is not entirely certain (c) The future exactly follows the patterns of the past (d) The future may not follow the patterns of the past
Solution & Step-by-Step Answer:
(d) The future may not follow the patterns of the past
Question 7
Maharashtra Board Solution
An overall upward or downward pattern in an annual time series would be contained in which component of the time series (a) Trend (b) Cyclical (c) Irregular (d) Seasonal
Solution & Step-by-Step Answer:
(a) Trend
Question 8
Maharashtra Board Solution
The following trend line equation was developed for annual sales from 1984 to 1990 with 1984 as base or zero year. Y1 = 500 + 60X (in 1000 Rs.) The estimated sales for 1984 (in 1000 Rs) is: (a) ₹ 500 (b) ₹ 560 (c) ₹ 1,040 (d) ₹ 1100
Solution & Step-by-Step Answer:
(a) ₹ 500
Question 9
Maharashtra Board Solution
What is a disadvantage of the graphical method of determining a trend line? (a) Provides quick approximations (b) Is subject to human error (c) Provides accurate forecasts (d) Is too difficult to calculate
Solution & Step-by-Step Answer:
(b) Is subject to human error
Question 10
Maharashtra Board Solution
Which component of time series refers to erratic time series movements that follow no recognizable or regular pattern. (a) Trend (b) Seasonal (c) Cyclical (d) Irregular
Solution & Step-by-Step Answer:
(a) Trend
(II) Fill in the blanks.
Question 1
Maharashtra Board Solution
_________ components of time series is indicated by a smooth line.
Solution & Step-by-Step Answer:
Trend
Question 2
Maharashtra Board Solution
_________ component of time series is indicated by periodic variation year after year.
Solution & Step-by-Step Answer:
Seasonal
Question 3
Maharashtra Board Solution
_________ component of time series is indicated by a long wave spanning two or more years.
Solution & Step-by-Step Answer:
Cyclical
Question 4
Maharashtra Board Solution
_________ component of time series is indicated by up and down movements without any pattern.
Solution & Step-by-Step Answer:
Irregular
Question 5
Maharashtra Board Solution
Addictive models of time series _________ independence of its components.
Solution & Step-by-Step Answer:
assume
Question 6
Maharashtra Board Solution
Multiplicative models of time series _________ independence of its components.
Solution & Step-by-Step Answer:
does not assume
Question 7
Maharashtra Board Solution
The simplest method of measuring the trend of time series is _________
Solution & Step-by-Step Answer:
graphical method
Question 8
Maharashtra Board Solution
The method of measuring the trend of time series using only averages is _________
Solution & Step-by-Step Answer:
moving average method
Question 9
Maharashtra Board Solution
The complicated but ancient method of measuring the trend of time series is _________
Solution & Step-by-Step Answer:
least-squares method
Question 10
Maharashtra Board Solution
The graph of time series clearly shows _________ of it is monotone.
Solution & Step-by-Step Answer:
trend
(III) State whether each of the following is True or False.
Question 1
Maharashtra Board Solution
The secular trend component of the time series represents irregular variations.
Solution & Step-by-Step Answer:
False
Question 2
Maharashtra Board Solution
Seasonal variation can be observed over several years.
Solution & Step-by-Step Answer:
True
Question 3
Maharashtra Board Solution
Cyclical variation can occur several times in a year.
Solution & Step-by-Step Answer:
False
Question 4
Maharashtra Board Solution
Irregular variation is not a random component of time series.
Solution & Step-by-Step Answer:
False
Question 5
Maharashtra Board Solution
The additive model of time series does not require the assumptions of independence of its components.
Solution & Step-by-Step Answer:
False
Question 6
Maharashtra Board Solution
The multiplicative model of time series does not require the assumption of independence of its components.
Solution & Step-by-Step Answer:
True
Question 7
Maharashtra Board Solution
The graphical method of finding trends is very complicated and involves several calculations.
Solution & Step-by-Step Answer:
False
Question 8
Maharashtra Board Solution
Moving the average method of finding trends is very complicated and involves several calculations.
Solution & Step-by-Step Answer:
False
Question 9
Maharashtra Board Solution
The least-squares method of finding trends is very simple and does not involve any calculations.
Solution & Step-by-Step Answer:
False
Question 10
Maharashtra Board Solution
All three methods of measuring trends will always give the same results.
Solution & Step-by-Step Answer:
False
(IV) Solve the following problems.
Question 1
Maharashtra Board Solution
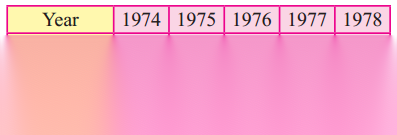
The following table shows the productivity of pig-iron and ferro-alloys (‘000 metric tonnes) Fit a trend line to the above data by graphical method.
Solution & Step-by-Step Answer:

Question 2
Maharashtra Board Solution
Fit a trend line to the data in Problem IV (1) by the method of least squares.
Solution & Step-by-Step Answer:
u = , Σy = 57, Σu = 0, Σu2 = 60, Σuy = 38, n = 9 Let the equation of the trend line be Y = a + bu where u = t – 1978 ……(i) Σy = na + bΣu ………(ii) Σuy = aΣu + bΣu2 ………(iii) Substituting the values of Σu, n, Σuy, Σu2 in (ii) & (iii) we get 57 = 9a + 0 ∴ a = 6.3333 38 = 0 + b. 60 ∴ b = 0.6333. ∴ The equation of the trend line is y = 6.3333 + 0.63333u where u = t – 1978

Question 3
Maharashtra Board Solution
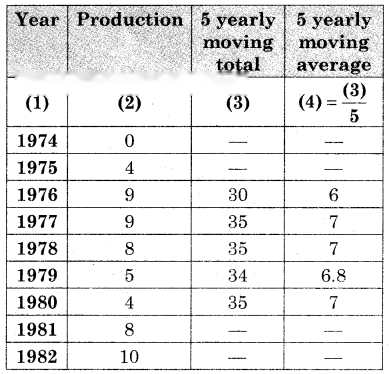
Obtain the trends values for the data on problem IV (1) using 5 yearly moving averages.
Solution & Step-by-Step Answer:
Question 4
Maharashtra Board Solution
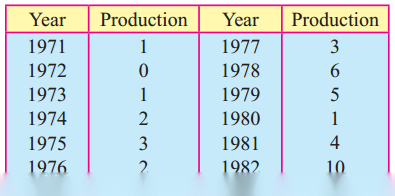
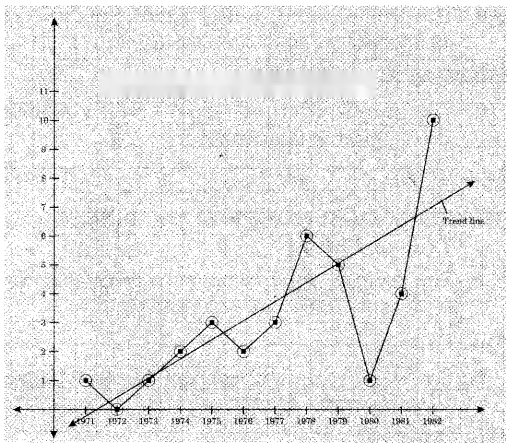
The following table shows the amount of sugar production (in lac tonnes) for the years 1971 to 1982. Fit a trend line to the above data by graphical method.
Solution & Step-by-Step Answer:
Question 5
Maharashtra Board Solution
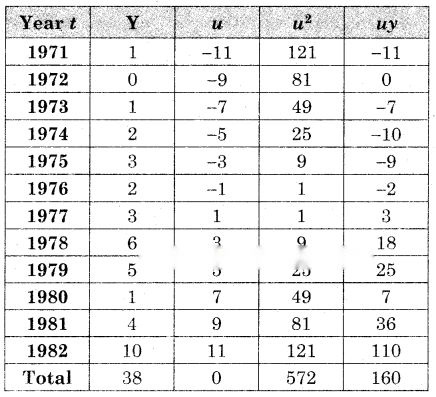
Fit a trend line to data in problem 4 by the method of least squares.
Solution & Step-by-Step Answer:
u = , Σy = 38, Σu = 0, Σu2 = 572, Σuy = 160, n = 12 Let the equation of the trend line be y = a + bu ……..(i) where u = u = 2t – 3953 Σy = na + bΣu ………(ii) Σuy = aΣu + bΣu2 ……..(iii) by (ii) 38 = 12o + 0 ∴ a = 3.1867 by (iii) 160 = 0 + b. 572 ∴ b = 0.2797 ∴ by (i), Equation of the trend line is Y = 3.1667 + 0.2797u where u = 2t – 3953.
Question 6
Maharashtra Board Solution
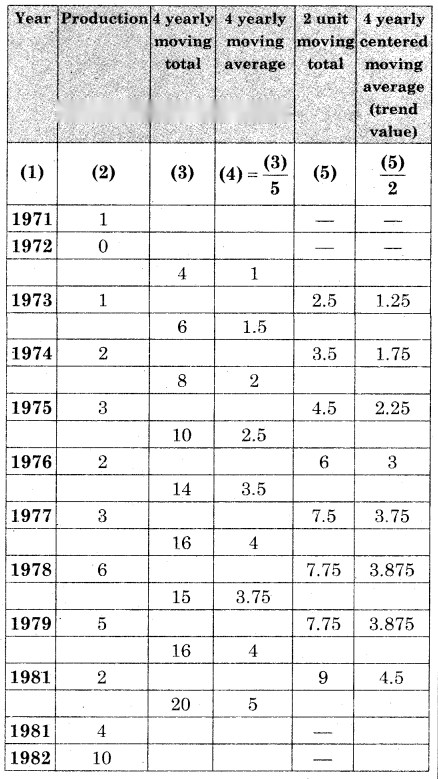
Obtain trend values for data in Problem 4 using 4-yearly centered moving averages.
Solution & Step-by-Step Answer:
Question 7
Maharashtra Board Solution
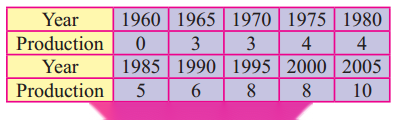
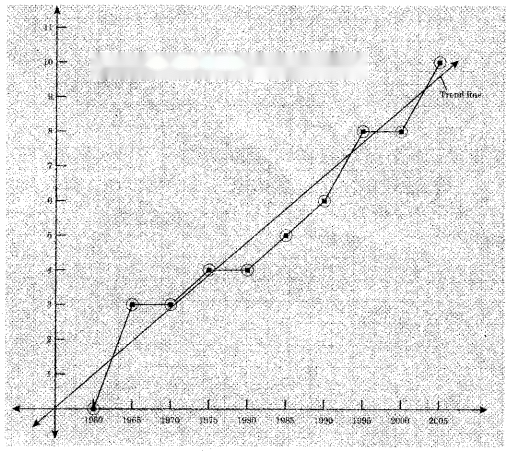
The percentage of girls’ enrollment in total enrollment for years 1960-2005 is shown in the following table. Fit a trend line to the above data by graphical method.
Solution & Step-by-Step Answer:
Question 8
Maharashtra Board Solution
Fit a trend line to the data in Problem 7 by the method of least squares.
Solution & Step-by-Step Answer:
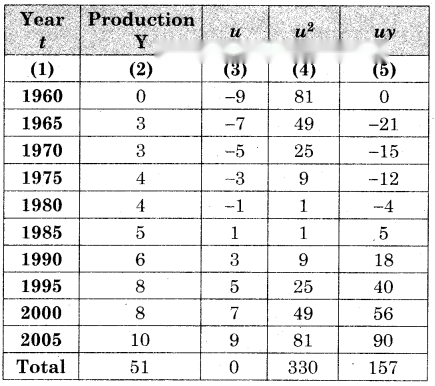
u = , Σy = 51, Σu = 0, Σu2 = 330, Σuy = 157, n = 10 Let the equation of the trend line be Y = a + bu where u = …….(i) Σy = na + bΣu ……..(ii) Σuy = aΣu + bΣu2 ……..(iii) Substituting the values of Σy, Σu, n, Σuy, Σu2 We get 51 = 10a + 0 ∴ a = 5.1 and 157 = 0 + 6.330 ∴ b = 0.4758 by (i) equation of the trend line is Y = 5.1 + 0.4758u where u =
Question 9
Maharashtra Board Solution
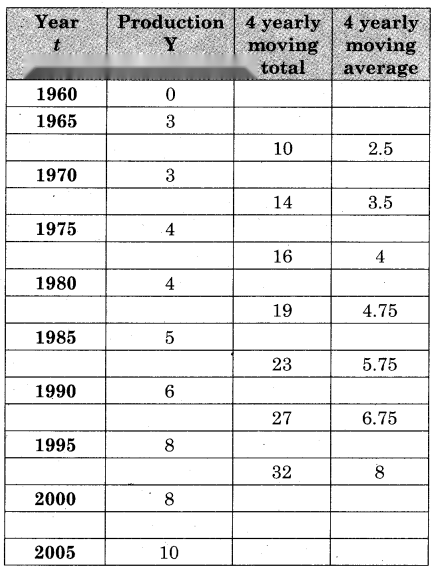
Obtain trend values for the data in Problem 7 using 4-yearly moving averages.
Solution & Step-by-Step Answer:
Question 10
Maharashtra Board Solution
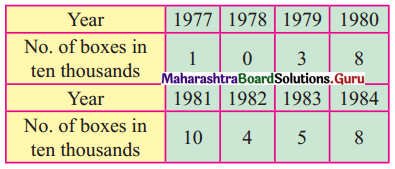
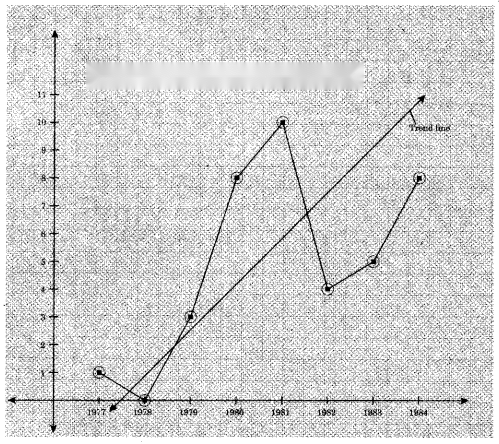
The following data shows the number of boxes of cereal sold in the years 1977 to 1984. Fit a trend line to the above data by graphical method.
Solution & Step-by-Step Answer:
Question 11
Maharashtra Board Solution
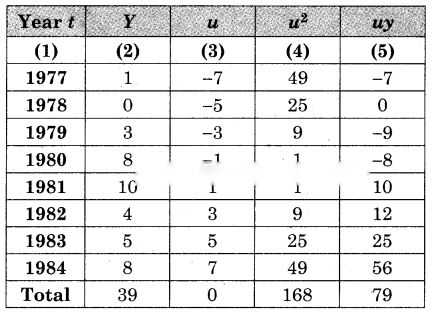
Fit a trend line to data in Problem 10 by the method of least squares.
Solution & Step-by-Step Answer:
u = , Σy = 39, Σu = 0, Σu2 = 168, Σuy = 79, n = 8 Let the equation of the trend line by Y = a + bu Where u = 2t – 3961 …….(i) Σy = na + bΣu …….(ii) Σuy = aΣu + bΣu2 ……..(iii) Substituting the values of Σy, n, Σu, Σuy, Σu2, in (ii) & (iii) 39 = 8a + 0 ∴ a = 4.875 79 = 0 + b (168) ∴ b = 0.4702 by (i) the equation of the trend line is Y = 4.875 + 0.4702u Where u = 2t – 3961.
Question 12
Maharashtra Board Solution
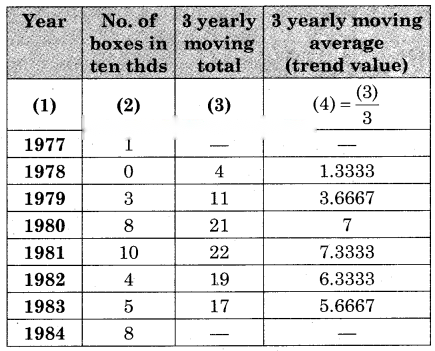
Obtain trend values for data in Problem 10 using 3-yearly moving averages.
Solution & Step-by-Step Answer:
Question 13
Maharashtra Board Solution
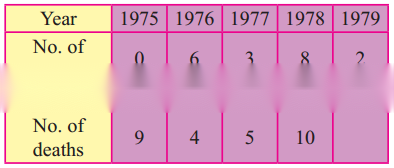
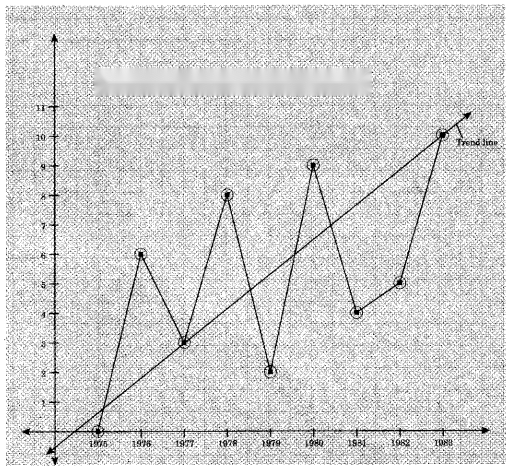
The following table shows the number of trade fatalities (in a state) resulting from drunken driving for the years 1975 to 1983. Fit a trend line to the above data by graphical method.
Solution & Step-by-Step Answer:
Question 14
Maharashtra Board Solution
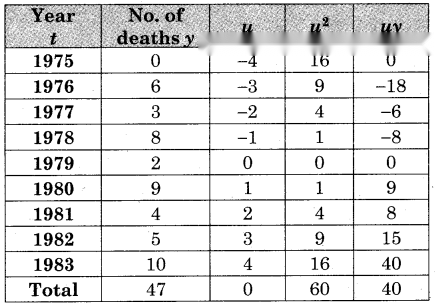
Fit a trend line to data in Problem 13 by the method of least squares.
Solution & Step-by-Step Answer:
u = , Σy = 47, Σu = 0, Σu2 = 60, Σuy = 40, n = 9 Let the equation of the trends line be Y = a + bu where u = t – 1979 …….(i) Σy = na + bΣu ………(ii) Σuy = aΣu + bΣu2 ……..(iii) Substituting values of Σy, n, Σu, Σuy, Σu2 in (ii) & (iii) We get 47 = 9a + 0 ∴ a = 5.2222 and 40 = 0 + b(60) ∴ b = 0.6667 ∴ by (i) the equation of the trend line is Y = 5.2222 + 0.6667u Where u = t – 1979.
Question 15
Maharashtra Board Solution
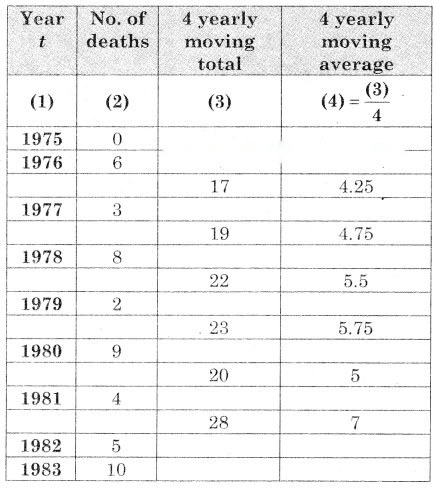
Obtain trend values for data in Problem 13 using 4-yearly moving averages.
Solution & Step-by-Step Answer:
Question 16
Maharashtra Board Solution
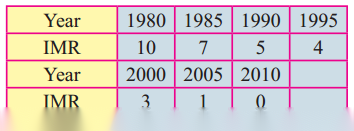
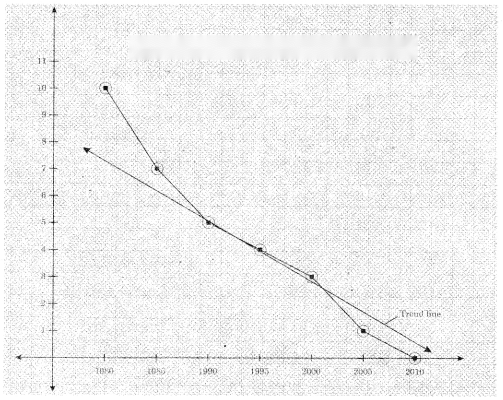
The following table shows the all India infant mortality rates (per ‘000) for the years 1980 to 2000. Fit a trend line to the above data by graphical method.
Solution & Step-by-Step Answer:
Question 17
Maharashtra Board Solution
Fit a trend line to data in Problem 16 by the method of least squares.
Solution & Step-by-Step Answer:
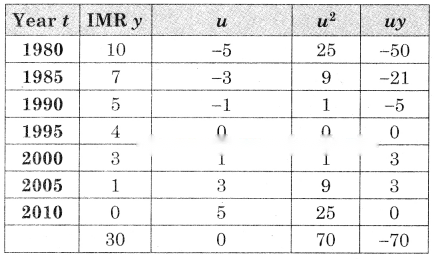
u = , Σy = 30, Σu = 0, Σu2 = 70, Σuy = -70, n = 7 Let the equation of the trend line be Y = a + bu Where u = …..(i) Σy = na + bΣu ……(ii) Σuy = aΣu + bΣu2 …….(iii) Substituting values of Σy, n, Σu, Σuy & Σu2 in (ii) & (iii) we get 30 = 7a + 0 ∴ a = 4.2857 -70 = 0 + 6(70) ∴ b = -1 ∴ by (i) the equation of the trend line is y = 4.2857 – 1(u) Where u =
Question 18
Maharashtra Board Solution
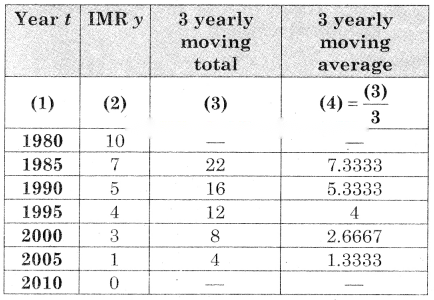
Obtain trend values for data in Problem 16 using 3-yearly moving averages.
Solution & Step-by-Step Answer:
Question 19
Maharashtra Board Solution
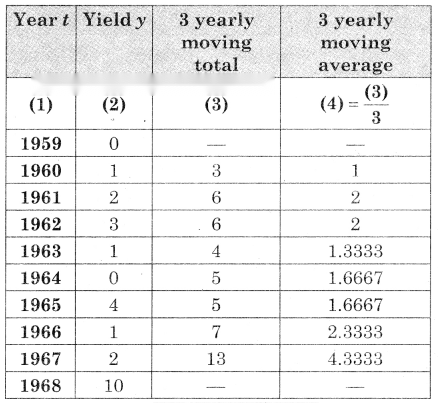
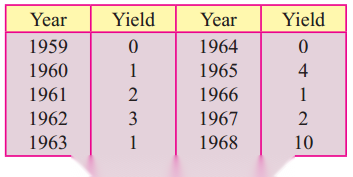
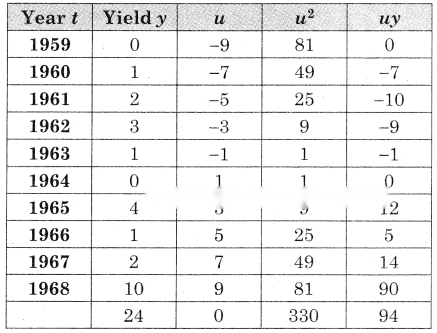
the following table shows the wheat yield (‘000 tonnes) in India for the years 1959 to 1968. Fit a trend line to the above data by the method of least squares.
Solution & Step-by-Step Answer:
u = , Σy = 24, Σu = 0, Σu2 = 330, Σuy = 94, n = 10 Let the equation of the trend line be y = a + bu where u = ……(i) i.e. u = 2t – 3927 Σy = na + bΣu …….(ii) Σuy = aΣu + Σu2 …..(iii) Substituting values of Σy, n, Σu, Σuy & Σu2 in (ii) & (iii) we get 24 = 10a + 0 ∴ a = 2.4 94 = 0 + 6.330 ∴ b = 0.2848 ∴ Equation of the trend line is y = 2.4 + (0.2848)u where u = 2t – 3927
Question 20
Maharashtra Board Solution
Obtain trend values for data in problem 19 using 3-yearly moving averages.
Solution & Step-by-Step Answer: